Lexicon · Guide
The best Kubernetes monitoring tools in 2026
Ten Kubernetes monitoring tools compared by deployment model, signals covered and how each one prices, with what each is genuinely best at.
Definition
Kubernetes monitoring tools are the platforms that collect, store and query telemetry from clusters and the workloads on them, and they differ less in what they can see than in where they run, what they charge for, and what happens to your data. This roundup covers ten of them, what each is genuinely good at, and the questions worth asking before you pick one.
Your cluster keeps scaling and the bill does not always explain why. Hundreds of pods, thousands of labels and telemetry volumes that grow on their own will make a well-built dashboard hard to navigate, and the short-lived, constantly changing nature of Kubernetes workloads creates problems that tools designed for static hosts were never built to handle.
The ten, and what each is for
Under each name is a screenshot of that vendor's own interface, so you can get a feel for what your team would be working in day to day. These are general product views rather than the Kubernetes-specific screens described below, and vendors redesign often enough that it is worth checking the current interface before you decide.
Prometheus
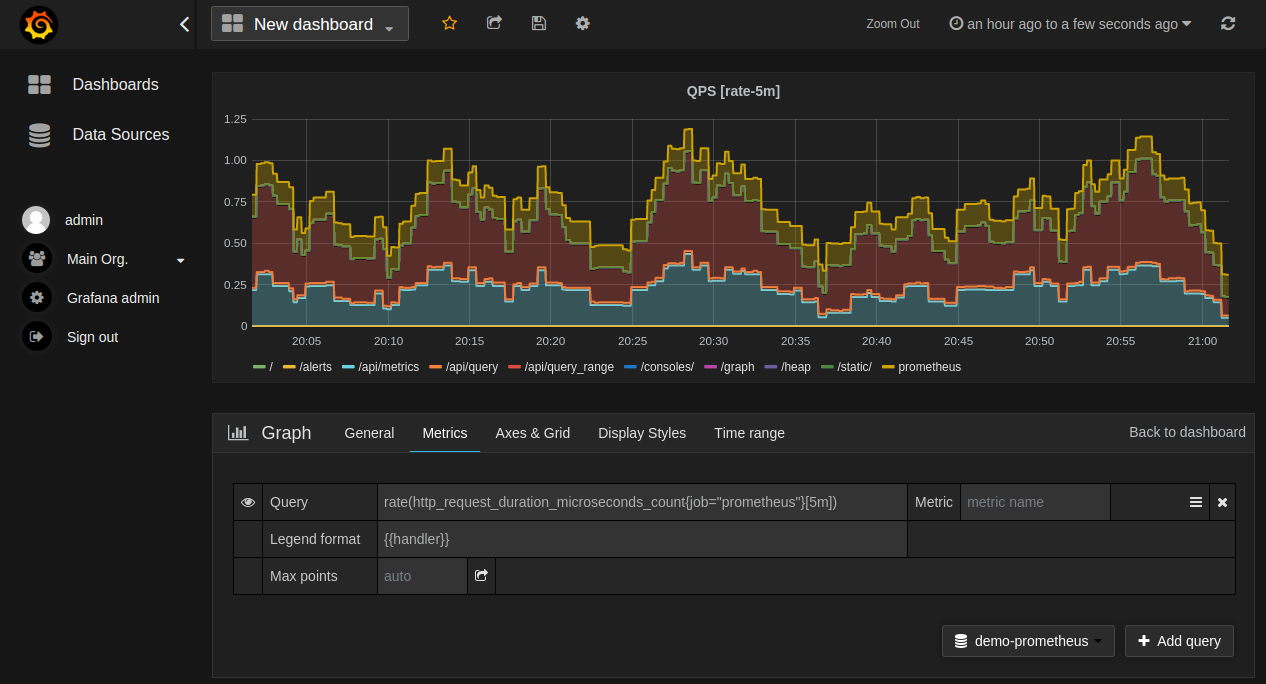
Prometheus is a CNCF-graduated metrics toolkit and the foundation most Kubernetes monitoring stacks are still built on. It discovers pods, services and nodes through the Kubernetes API rather than static configuration, scrapes them on an interval so a failed scrape stays visible instead of vanishing, and lets you query with the same concepts you use to organize workloads.
Its scope is metrics rather than full observability, with logs and traces outside the core project. That is a reasonable division of labor rather than a shortcoming, and it is why Prometheus so often sits underneath something else.
Key features
Kubernetes service discovery: Queries the Kubernetes API to find pods, services and nodes as they are created or removed, keeping scrape targets current without static configuration.
Pull-based scraping: Fetches metrics from each target on an interval, so a failed scrape stays visible rather than silently disappearing.
PromQL: A label-based query language for aggregating and filtering metrics across pods, services and namespaces.
kube-state-metrics integration: Exposes Kubernetes object state, including deployment replica counts, pod status and resource requests.
Alertmanager: Handles alert routing, grouping and deduplication separately from Prometheus, which makes noisy or repeated alerts easier to manage.
Pricing
No license cost, since it is free open-source software. Running it in production means paying for the servers, storage and scaling it needs.
Tsuga
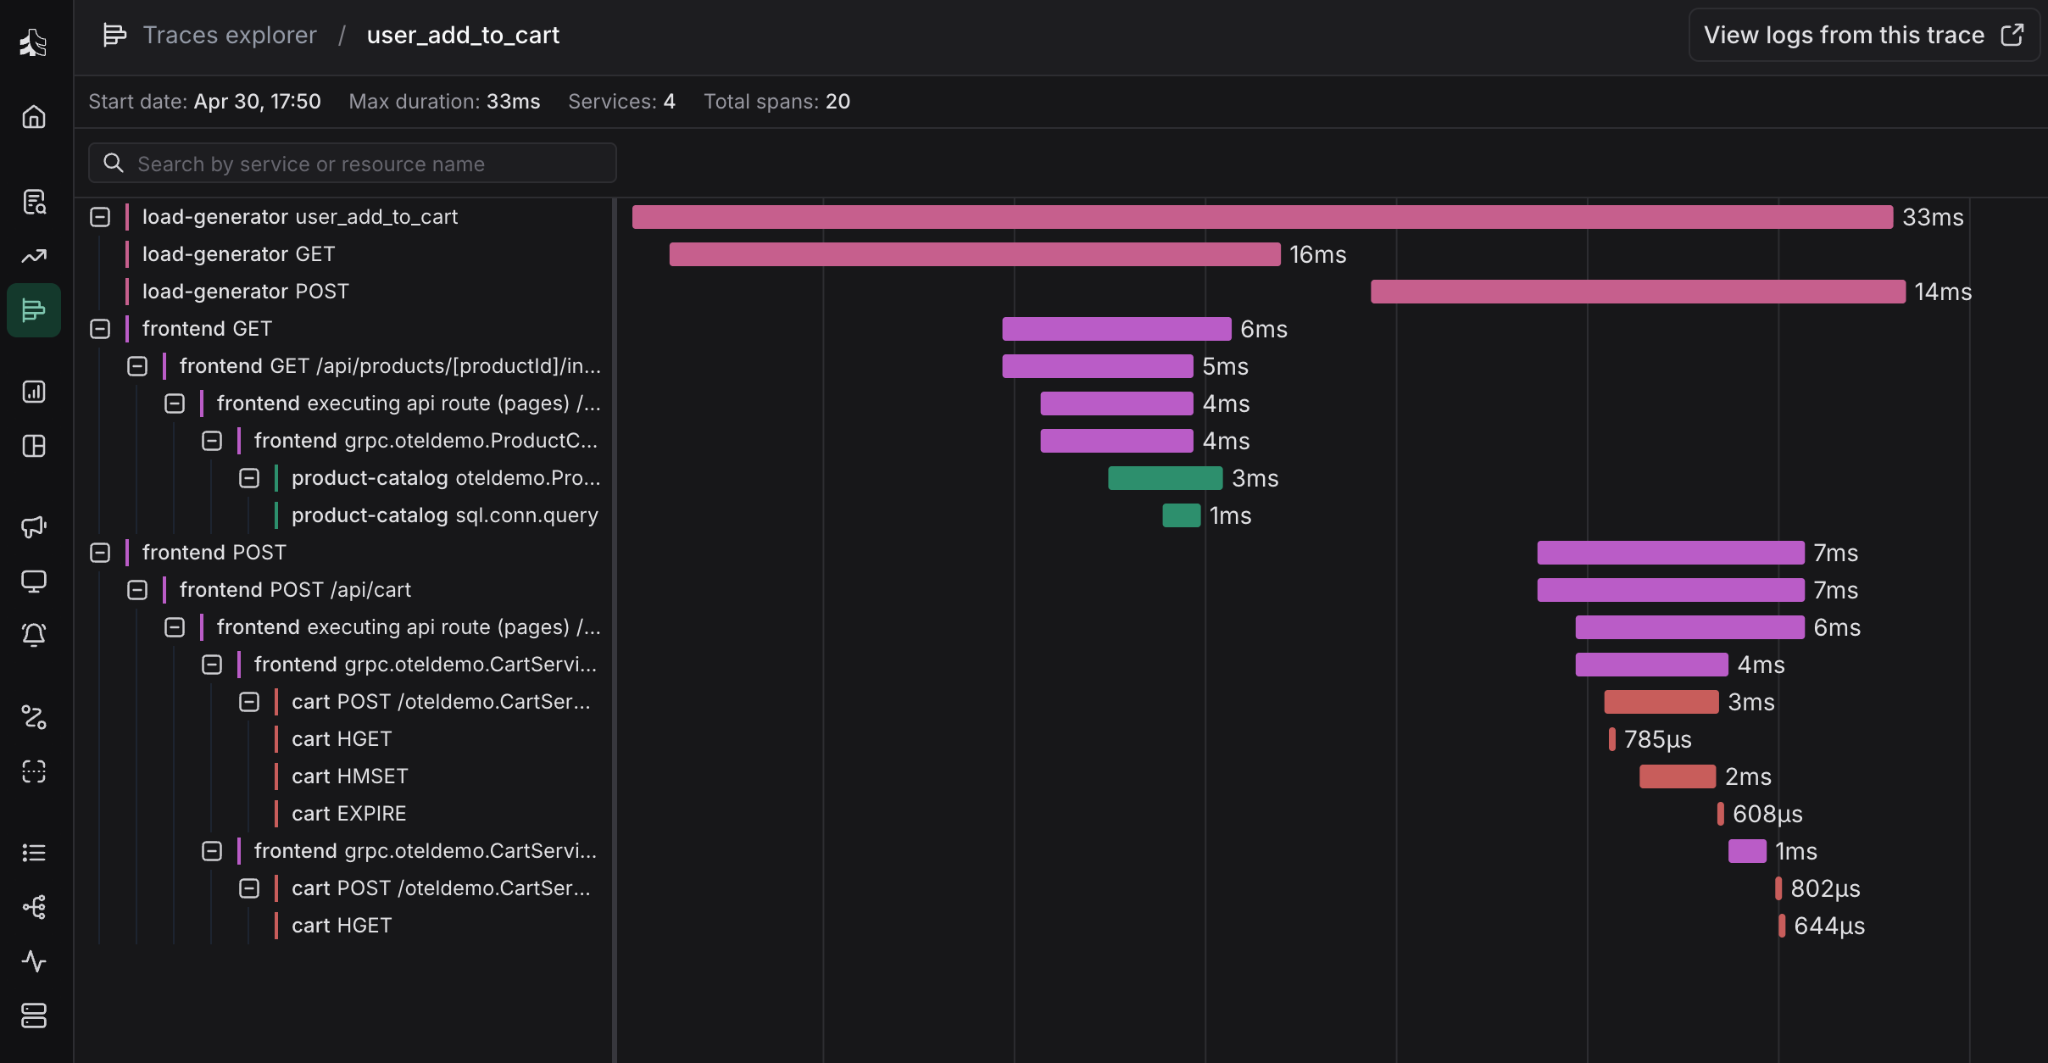
We deploy observability clusters inside your own cloud account, so Kubernetes logs, metrics and traces stay alongside the workloads they describe. We manage deployment, upgrades and autoscaling remotely while storage and compute stay on your cloud bill, which means telemetry growth becomes part of infrastructure you already own rather than a separate bill that rises with every host and pod.
Cardinality quality reports surface high-cardinality tags and unused metrics, inline filtering and transformation happen at the edge before storage, and SLOs can be defined and tracked per workload. Storage and compute run in your own cloud account, so they show up directly on your own cloud bill.
Key features
In-cluster BYOC deployment: Runs observability infrastructure inside your own cloud account on AWS, Google Cloud or Azure, using infrastructure-as-code, so pod and node telemetry stays within the same cloud boundary as the workloads.
Cardinality quality reports: Detects high-cardinality tags and unused metrics, so teams can cut Kubernetes telemetry without losing useful context.
Inline WASM filter transformation: Filters and transforms telemetry at the edge before storage, reducing the pod-level logs and metrics that would otherwise need downstream indexing.
SLI and SLO definition: Lets teams set service-level objectives for Kubernetes workloads and track performance against them rather than against raw metrics.
Hands-on tuning: We work closely with your team to tune retention, pipelines and access as the cluster's telemetry needs change.
Pricing
Storage and compute run in your own cloud account, so they show up directly on your cloud bill, at your provider's rates. To see what that means for your clusters, talk to an architect, who can model it against your actual traffic.
Grafana Cloud
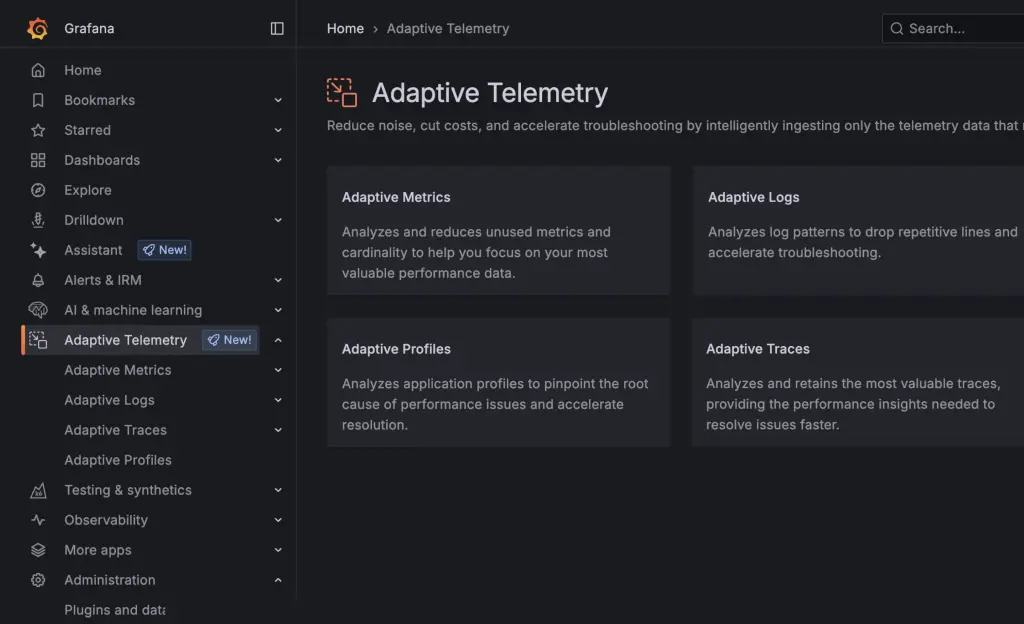
Grafana Cloud packages Loki, Grafana, Tempo and Mimir as a managed backend, so teams collect Prometheus-based metrics, logs and traces without operating the storage layer. Its Kubernetes app organizes telemetry around clusters, nodes, pods and containers, and a curated Helm chart installs the collectors with sensible defaults.
It also detects workloads beyond the standard Deployments and StatefulSets, including Argo Rollouts and bare pods, and brings cluster events into the same object views as the metrics. For a team already invested in the Grafana ecosystem, the continuity is the main argument.
Key features
Kubernetes Monitoring app: Views organized around clusters, nodes, pods and containers, so issues are investigated inside the Kubernetes structure rather than beside it.
Curated Helm chart deployment: Installs Node Exporter and Grafana Alloy with collection preconfigured, which removes most of the manual setup.
Non-standard workload detection: Picks up workloads beyond Deployments and StatefulSets, including Argo Rollouts, Strimzi PodSets and bare pods.
Cost and resource views: Shows utilization and spend by cluster, which is usually how over-provisioned workloads get found.
Logs and events correlation: Brings logs and Kubernetes events into the same object views as metrics, reducing tool switching during an investigation.
Pricing
Free to start, then a Pro plan with a monthly platform fee plus usage. Kubernetes Monitoring bills per host hour and per container hour, with metrics, logs and traces priced separately, and Enterprise is an annual commitment.
Datadog
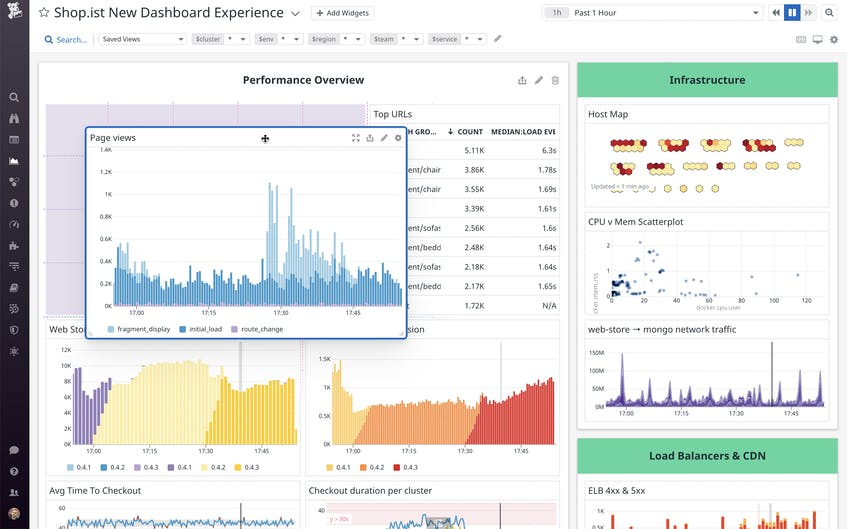
Datadog runs an agent as a DaemonSet with a cluster agent talking to the API server, which together collect metrics, logs, traces and container state without per-service configuration. Its Kubernetes Explorer moves you from a namespace-level problem to a specific pod without changing screens, and autodiscovery applies monitoring templates to containerized services as they start.
The breadth is genuinely unmatched, and so is the configuration-free onboarding. What comes with it is a bill assembled from several meters at once, which is why cost management tends to become its own engineering discipline.
Key features
Autodiscovery: Detects containerized services as they start and applies the matching monitoring template automatically.
Kubernetes Explorer: Resource-level views of pods, deployments and namespaces, with cluster maps, failed pod detail and the related logs in reach.
Cluster Agent: Queries the Kubernetes API on behalf of the node agents, which cuts direct API traffic and centralizes cluster metadata.
Kubernetes tag mapping: Converts pod and node labels and annotations into Datadog tags, making Kubernetes metadata available for filtering and grouping.
Orchestrator-level tagging: Adds pod and container context to metrics, which is what isolates an issue in a dense or fast-changing cluster.
Pricing
A free tier for a small number of hosts, then per host, with APM priced on top of infrastructure monitoring. Cluster autoscaling pushes the host count, and the bill, higher during traffic spikes.
Dynatrace
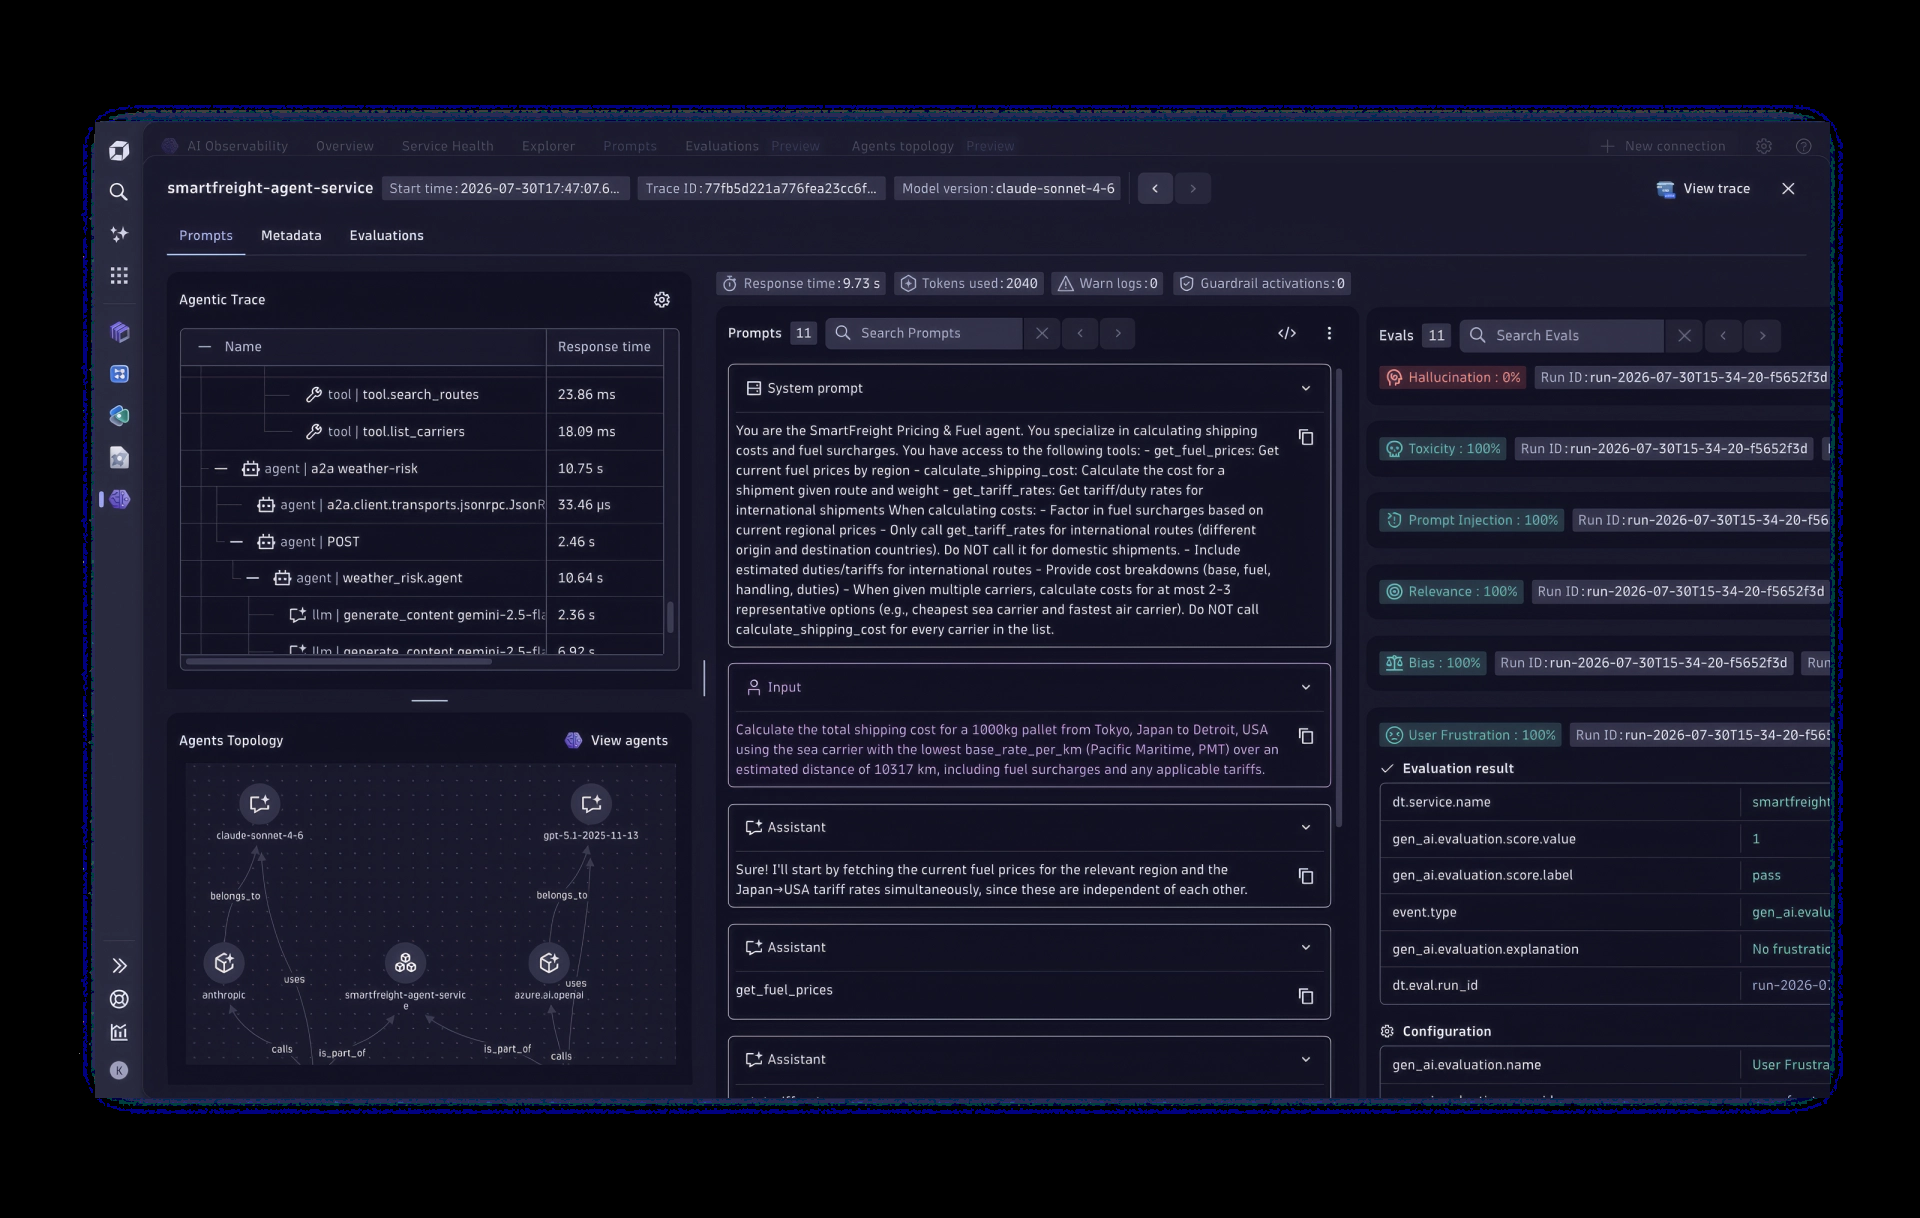
Dynatrace uses a single agent to discover pods, services and dependencies without deployment changes, then feeds that into a live topology model of how services connect. Its AI correlates anomalies across nodes, pods, containers and applications to propose a root cause rather than a list of symptoms, and groups alerts from one underlying issue into a single notification.
For a large enterprise estate where dependency mapping is the hard part, that automation is the reason to look at it. The trade is that the topology model works best when the whole estate is instrumented its way.
Key features
OneAgent auto-instrumentation: Discovers pods, services and dependencies after deployment, so new workloads are monitored without config or code changes.
Smartscape topology mapping: Builds a real-time map of service relationships, showing how an issue in one workload reaches the services that depend on it.
Davis AI root cause analysis: Correlates anomalies across infrastructure and application layers to name a likely cause instead of listing symptoms.
Problem-based alert grouping: Collapses alerts from one underlying issue into a single notification, which cuts the repetition of a multi-service incident.
Workload and resource views: Shows replica counts, resource limits and utilization by workload, making the configuration problems behind instability easier to spot.
Pricing
Kubernetes Platform Monitoring is priced per pod on its own, and included for hosts running Full-Stack Monitoring, which is priced per host by memory size. Both draw down an annual platform commitment.
New Relic
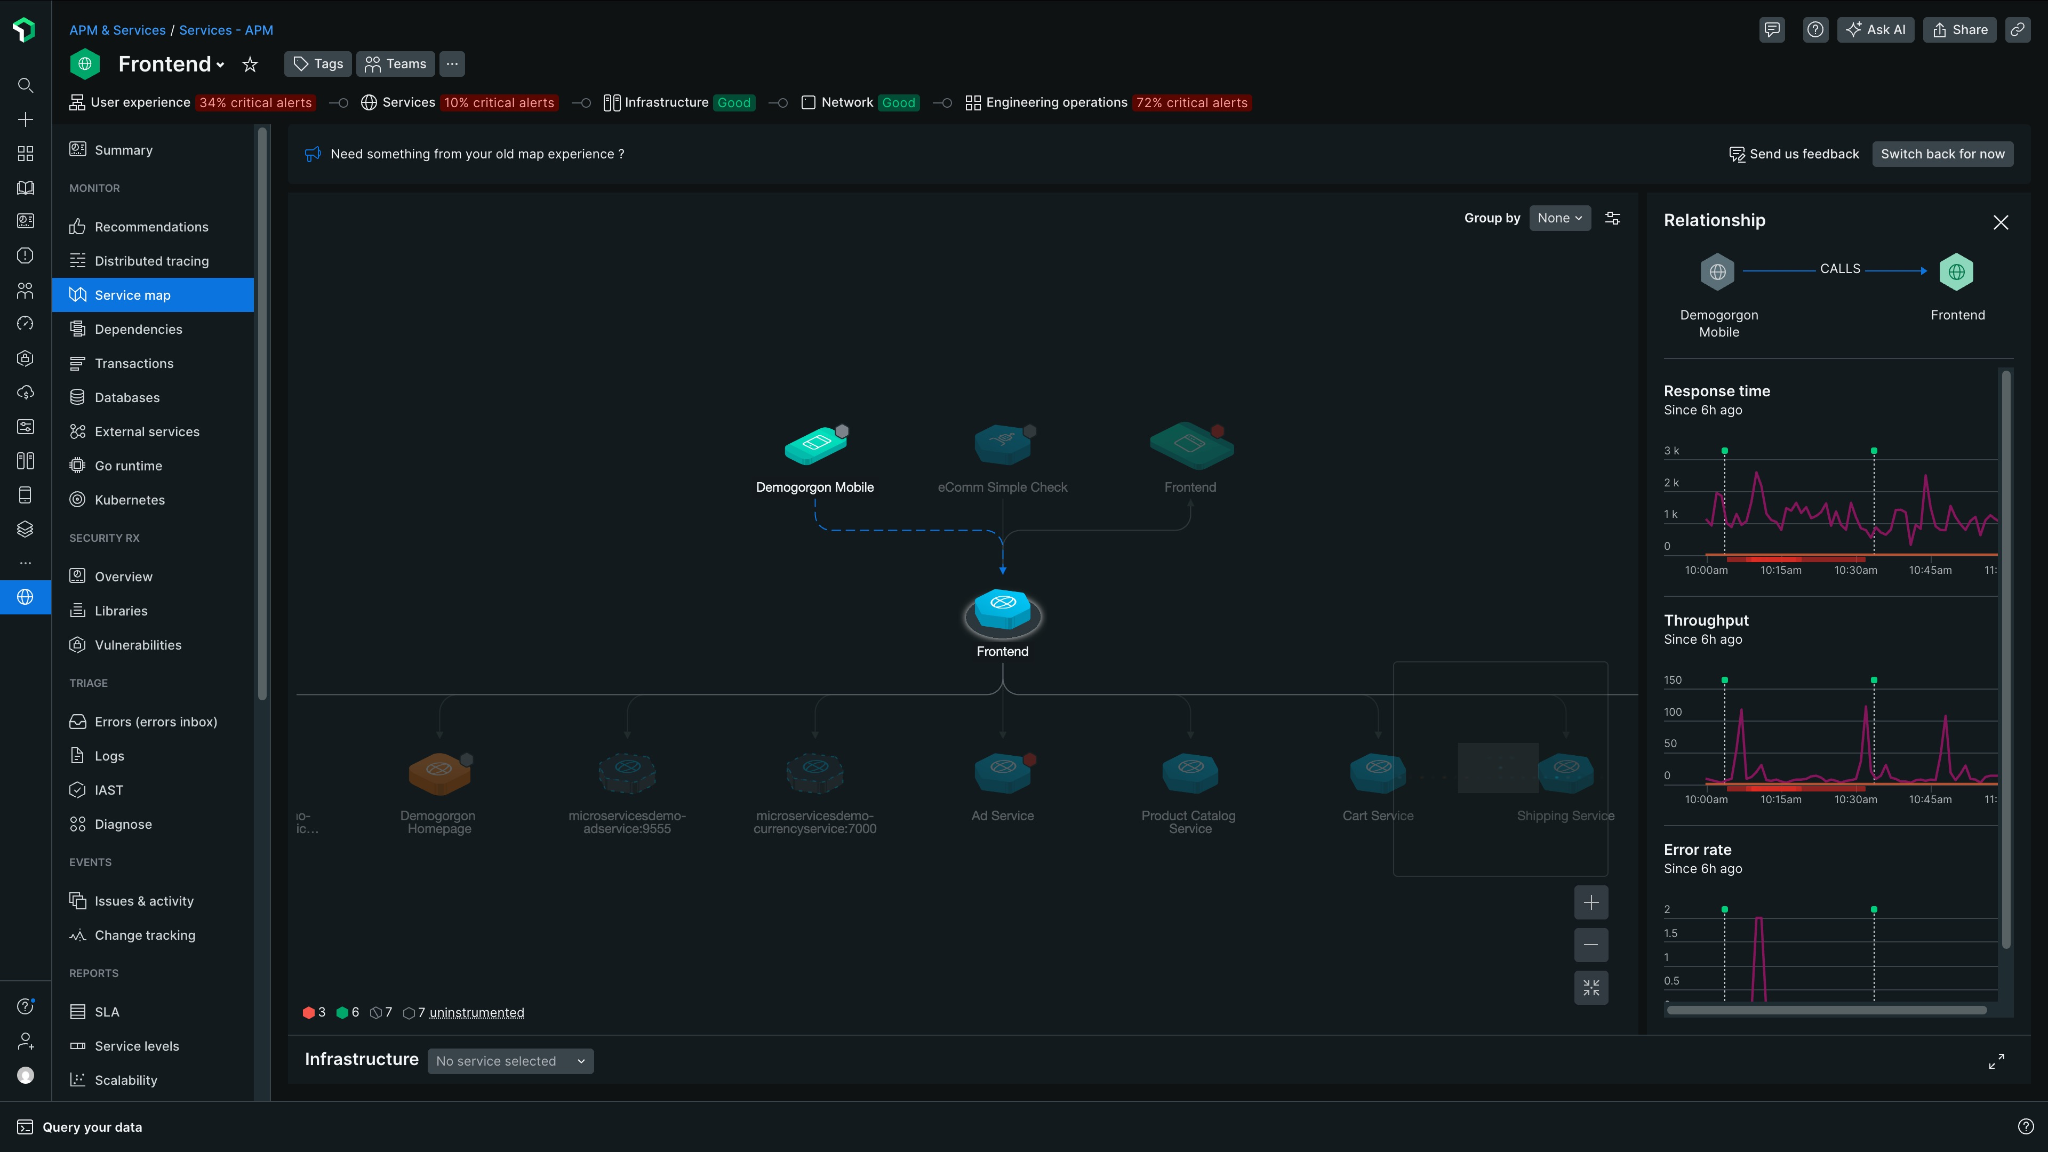
New Relic pairs a standard Kubernetes integration covering nodes, namespaces, deployments and pods with eBPF-based telemetry that captures traces, HTTP calls and service maps without language-specific instrumentation. An engineer can move from a pod restart to the slow query behind it without assembling the picture across tools.
It ships predefined alerts for the failures every cluster meets, CrashLoopBackOff and OOMKilled among them. That is a small thing, and it saves the kind of setup time nobody budgets for.
Key features
Auto-telemetry with Pixie: eBPF capture of traces, HTTP calls and service maps across workloads, with no language-specific instrumentation and no code changes.
Kubernetes cluster explorer: The cluster from control plane through nodes and pods, with Kubernetes data collected separately from Pixie's application telemetry.
APM auto-attach: Links application performance data to Kubernetes deployments without extensive manual setup.
Live debugging with flame graphs: Identifies slow code and resource-heavy operations from Pixie's continuous collection.
CrashLoopBackOff and OOMKilled detection: Predefined alerts for the common Kubernetes failures, so nobody writes those rules from scratch.
Pricing
Billed on data ingested plus user seats, so going from 50 to 500 pods does not multiply the bill on its own. A free tier covers a monthly data allowance, and beyond that data is billed per GB plus per-user fees.
Sysdig
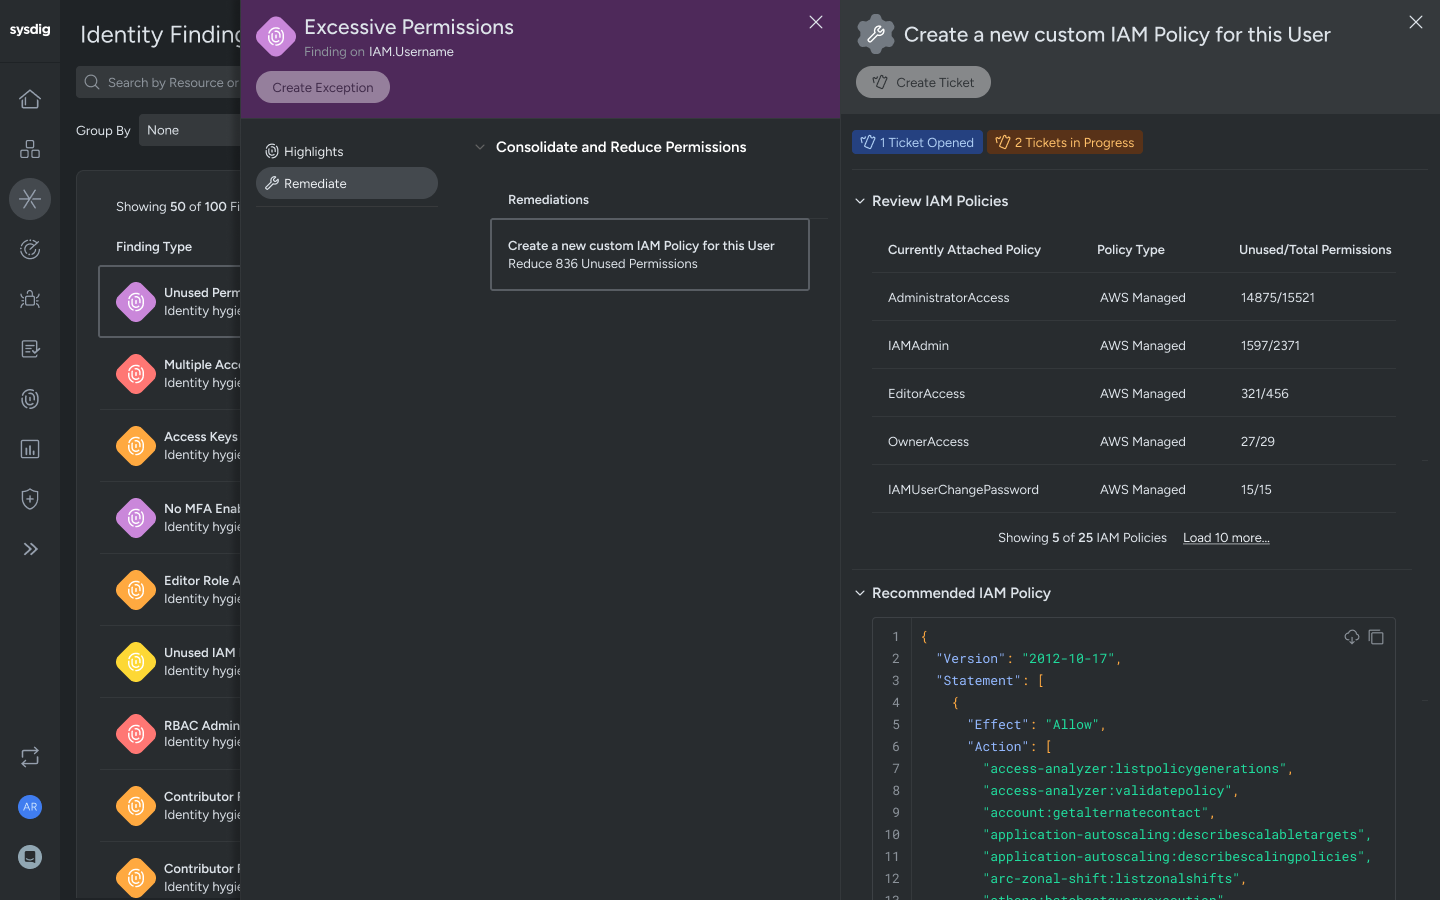
Sysdig offers managed Prometheus with PromQL and Grafana-compatible dashboards, collecting on a ten second interval by default and adding Kubernetes context such as events, process activity and network metrics. Its advisor surfaces the common cluster problems with remediation steps and the relevant logs attached.
The distinctive part is that monitoring and runtime security share one collection layer. A performance question and a security question can then be investigated without maintaining two pipelines, which is a real saving for teams that own both.
Key features
Advisor: Surfaces the common cluster problems, CrashLoopBackOffs, pod evictions and resource limit trouble among them, with remediation steps and the relevant logs.
Cost Advisor: Breaks Kubernetes cost down by cluster, namespace and workload, and flags idle or overprovisioned compute.
Managed Prometheus service: Handles Prometheus storage and scaling, which removes the operational work of running it at cluster scale.
Falco-based runtime security: Watches kernel-level system calls against defined rules to catch unusual container behavior, using the same agent that collects the monitoring data.
Dashboard library: Ready-made dashboards for workload and pod health, resource availability and capacity planning across clusters.
Pricing
Priced per host, with custom metrics billed separately by time series. What a host costs depends on the product mix and on cluster cardinality.
Elastic Observability
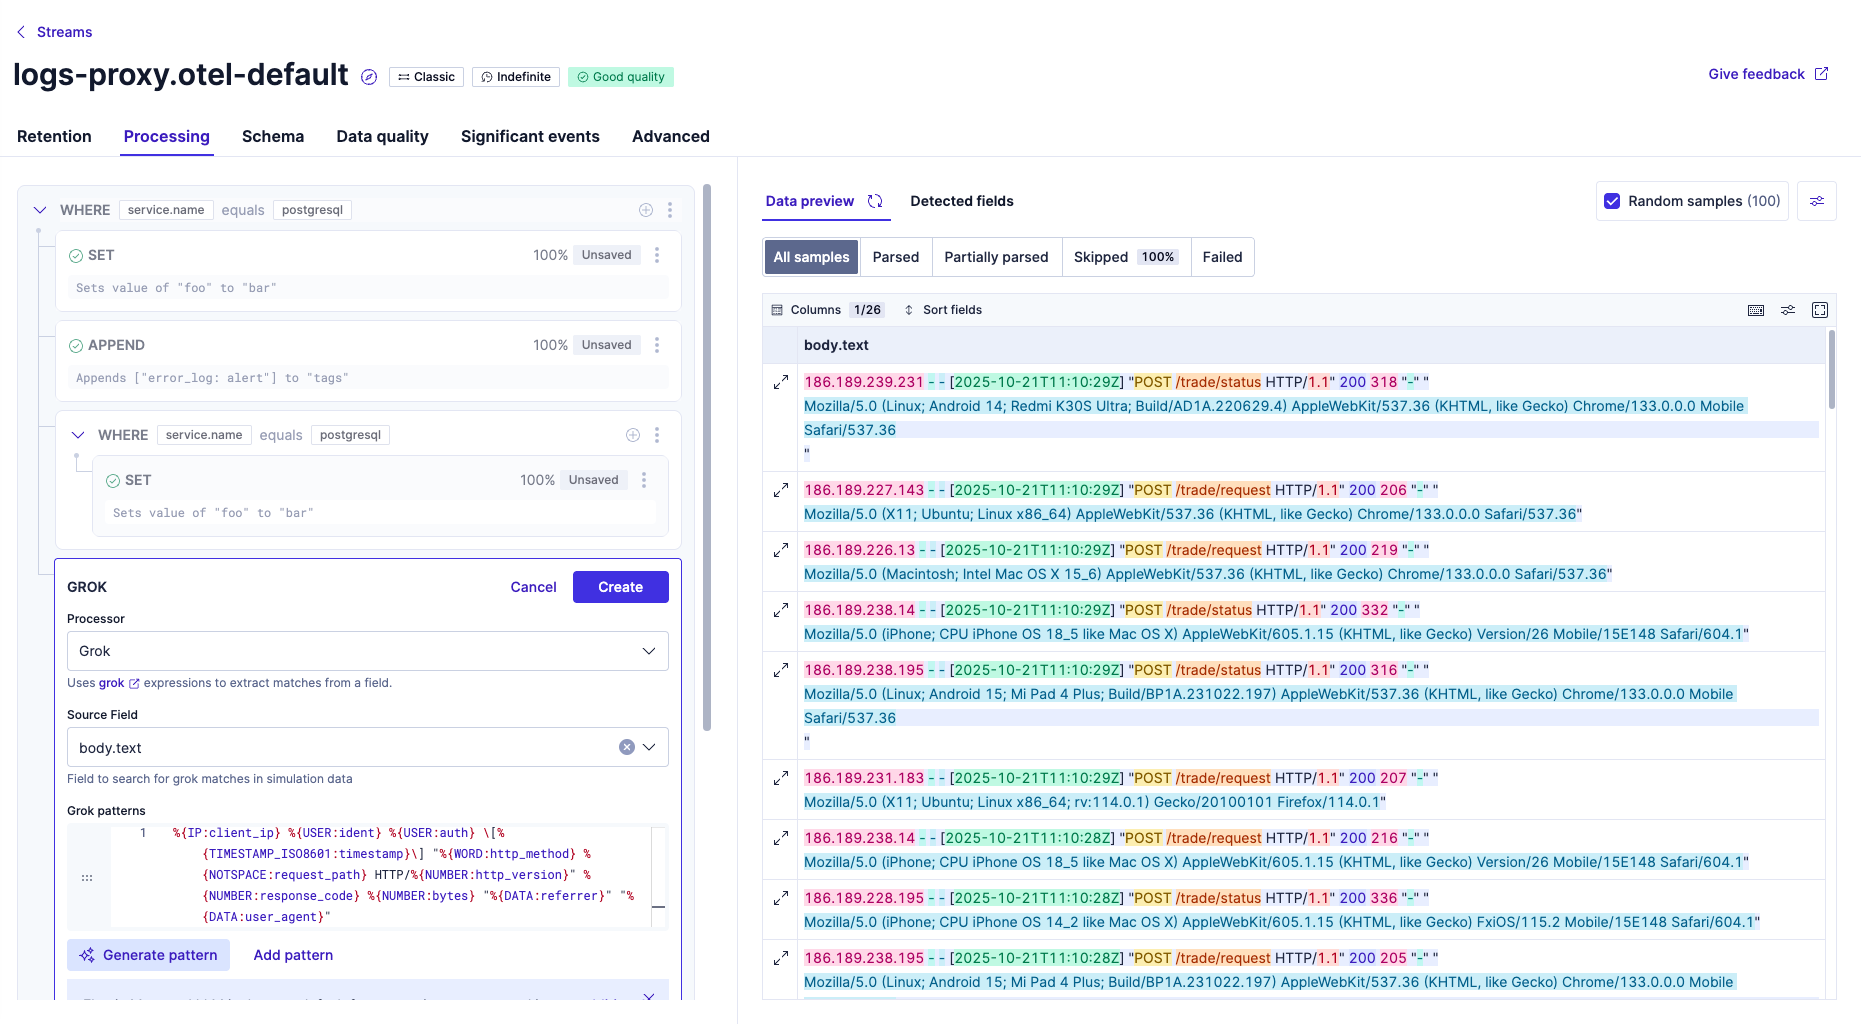
Elastic collects through its own OpenTelemetry distribution deployed as a DaemonSet, gathering node, pod, container and application telemetry alongside logs and traces. Its columnar time series storage is built for label growth, which is the specific problem ephemeral pods create, and it accepts Prometheus remote write so existing scrape configuration keeps working.
If your constraint is cardinality and you are standardizing on OpenTelemetry, that storage architecture is the argument. It also puts security data in the same place, which some teams want and others deliberately keep apart.
Key features
EDOT Kubernetes collectors: Deploys OpenTelemetry collectors through the kube-stack Helm chart, collecting Kubernetes state data without a separate exporter.
Time Series Data Stream architecture: Stores high-cardinality metrics in a columnar, on-disk format, which keeps memory pressure down as pod and namespace labels churn.
Native Prometheus remote write: Accepts existing Prometheus metrics directly, so scrape configuration survives the move to Elastic storage and querying.
Automatic downsampling: Cuts the storage historical metrics need while keeping higher resolution for recent investigations.
Kubernetes Security Posture Management: Flags configuration problems in cluster and workload manifests before they reach production.
Pricing
Priced on ingest and retention, per GB ingested plus per GB retained each month. Clusters producing more logs and metrics cost proportionally more, regardless of node count.
Splunk Observability Cloud
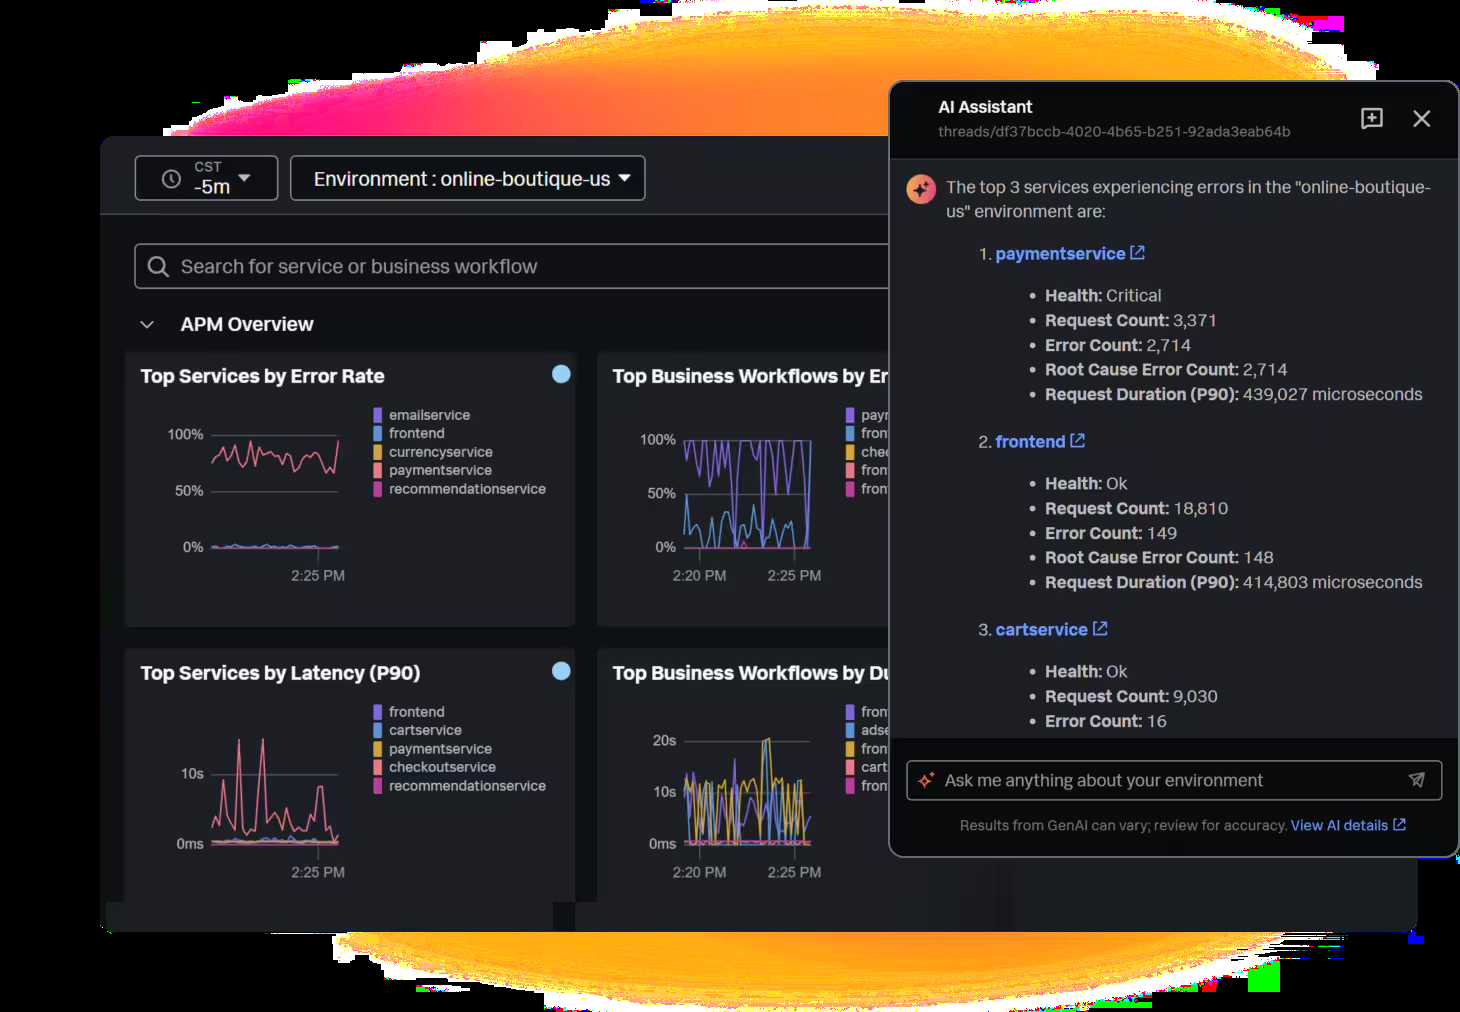
Splunk collects through an OpenTelemetry Collector and presents clusters as a navigable map of nodes, pods and containers with health visible at each level. Data appears within seconds of the collector connecting, and its detectors cover common Kubernetes anomalies without anyone writing rules first.
Teams who think visually tend to get on with it quickly. Moving from a cluster view down to a single pod without first building the dashboard to do it is the part people remember.
Key features
Kubernetes Navigator: A hierarchy-based map of nodes, pods and containers, with statuses such as Node Ready, Memory Pressure and Pod Phase visible at a glance.
AutoDetect: Creates detectors for common Kubernetes anomalies automatically, giving baseline monitoring without configuring rules from scratch.
Kubernetes entities view: Table, dashboard and heatmap views, with filters across each for exploring cluster data.
OpenTelemetry Collector-based ingestion: Populates the Kubernetes views from OTel Collector metrics, which keeps collection on an open standard.
Related content links: Connects AutoDetect alerts to runbooks and APM traces, adding context at the moment an engineer needs it.
Pricing
A free edition, then per host, in tiers that step up from infrastructure to app and infrastructure to end-to-end coverage, all billed annually. Kubernetes nodes count as hosts, so autoscaling raises the host count and the bill.
SigNoz
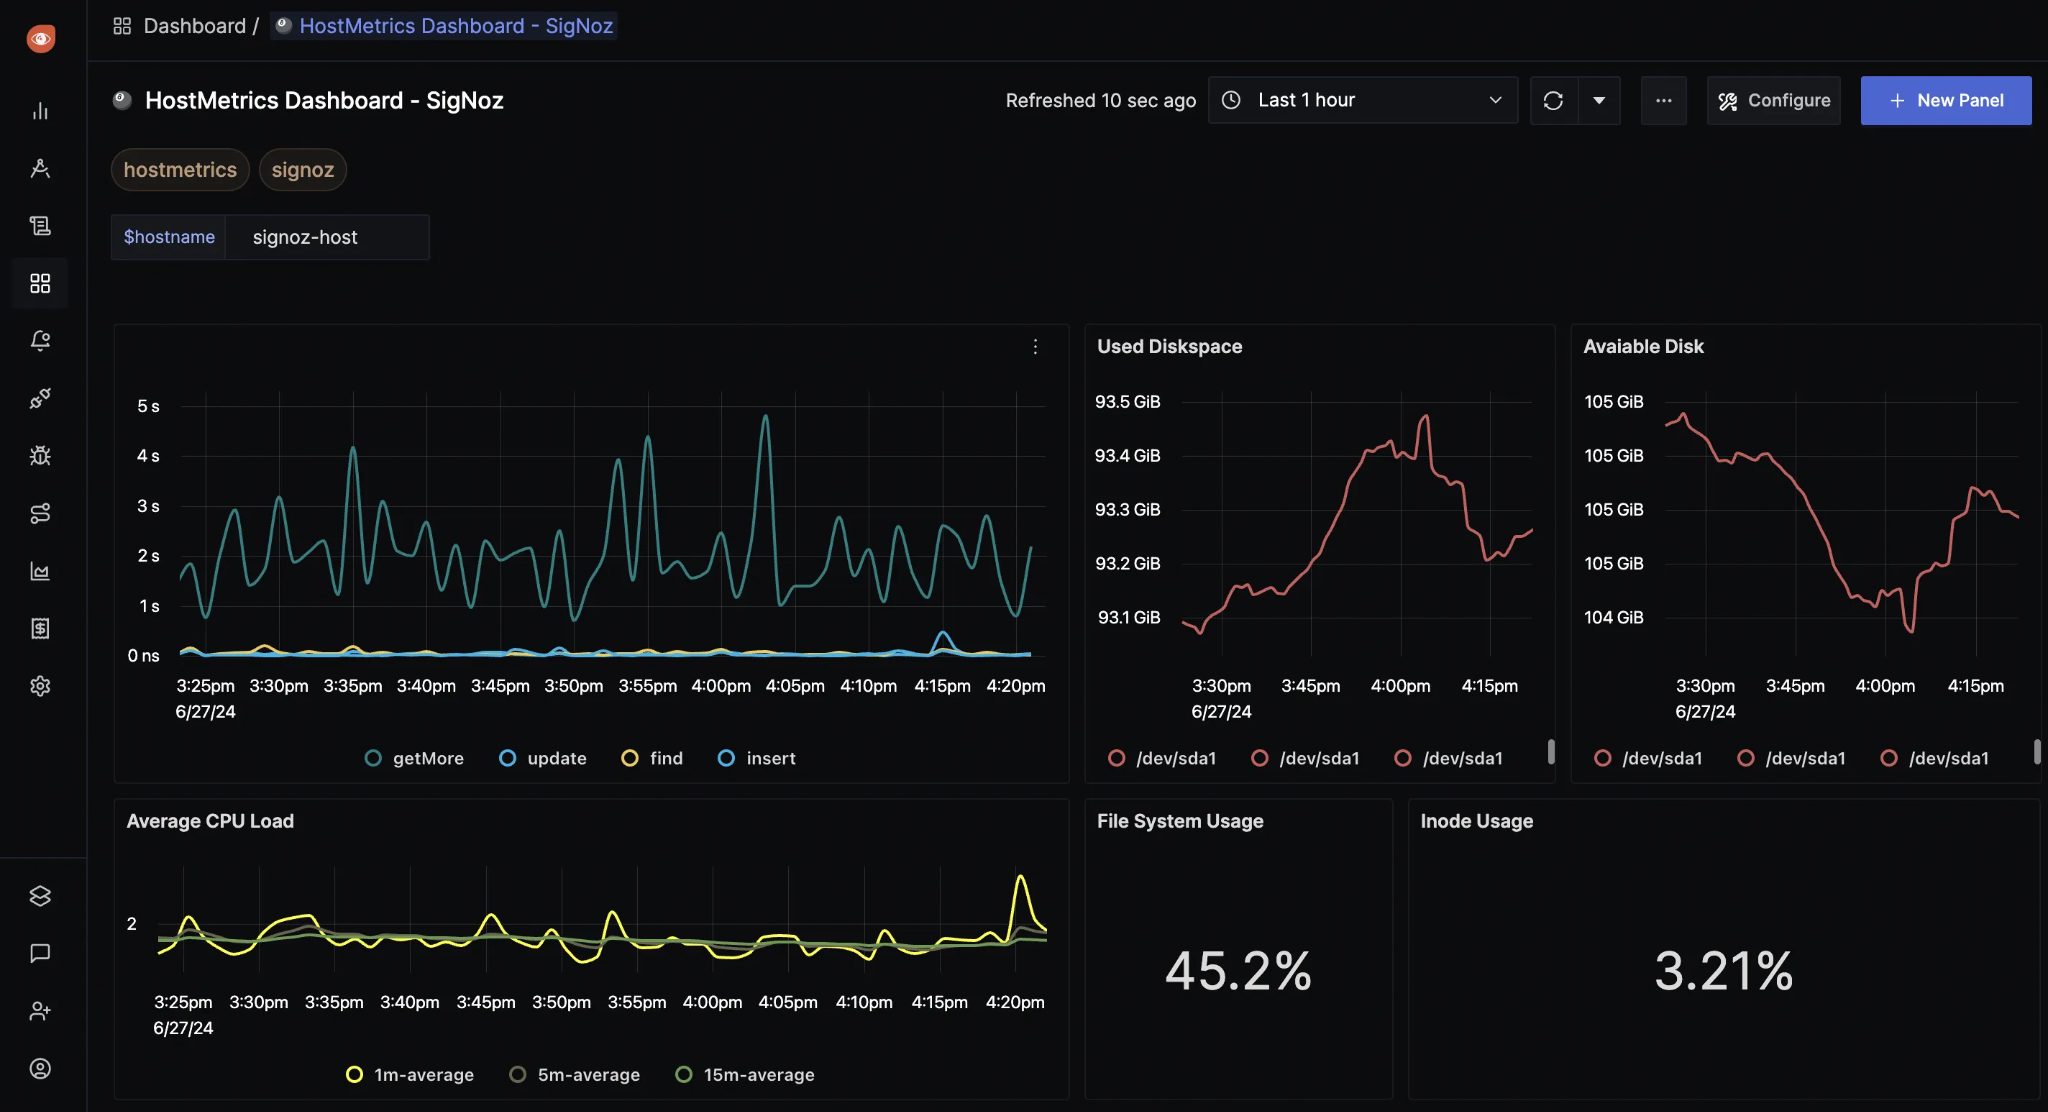
SigNoz was built around OpenTelemetry from the start, so clusters send metrics, logs and traces through the standard Collector rather than a proprietary agent. Everything lands in one backend, which makes moving from a pod restart to the relevant traces and logs a single investigation rather than three.
It also exposes cluster context, pod status and node metrics to coding agents through an MCP server. For teams who investigate from a terminal and increasingly from an agent, that is a genuinely forward-looking piece of design.
Key features
OTel Collector via Helm: Deploys collector components with the k8s-infra chart, a DaemonSet for node and pod data and a Deployment for cluster metrics and events.
Pod-level cluster monitoring: Tracks CPU, memory, disk and network for individual pods and nodes, with dashboards for pod health and resource saturation.
Kubernetes events monitoring: Collects cluster state-change events through the collector, which is what tells you what preceded a pod failure.
Unified logs, metrics and traces: Keeps the three signals in one backend, simplifying correlation between application behavior, infrastructure and log evidence.
MCP server for coding agents: Exposes cluster context, pod status, node metrics and traces to agents such as Claude Code, so an investigation can run from a terminal workflow.
Pricing
SigNoz Cloud has a monthly base fee with no host or user fees, then charges per GB for logs and traces and per million samples for metrics. Unlimited hosts are monitored on any plan.
Related terms
- DatadogDatadog is the largest SaaS observability platform, spanning infrastructure monitoring, APM, logs, RUM, security, and dozens of adjacent products, collected largely through its proprietary agent and priced per product.
- DynatraceDynatrace is an enterprise observability platform known for its OneAgent automatic instrumentation, the Davis AI engine for root cause analysis, and the Grail data lakehouse, sold on a consumption based pricing model.
- Elastic ObservabilityElastic offers observability built on the Elasticsearch stack: log search at its core, with metrics, traces, and APM layered on, available self managed or as the hosted Elastic Cloud.
- GrafanaGrafana is the open source standard for dashboards, and Grafana Labs builds an observability stack around it: Loki for logs, Tempo for traces, Mimir for metrics, with Grafana Cloud as the managed offering.
- Kubernetes monitoringKubernetes monitoring is observability applied to Kubernetes clusters: the nodes, workloads, pods, and containers that run modern applications, plus the control plane that orchestrates them.
- New RelicNew Relic is one of the original APM vendors, now a broad all in one observability SaaS covering APM, infrastructure, logs, browser monitoring, and more, priced on data ingested plus per user seats.
- SplunkSplunk is the long standing leader in log analytics and SIEM, acquired by Cisco in 2024, offering log search through its SPL query language plus an observability suite spanning metrics and traces.