Announcing our $35m fundraise! Read all about it here

Infrastructure monitoring that keeps every dimension your systems need.

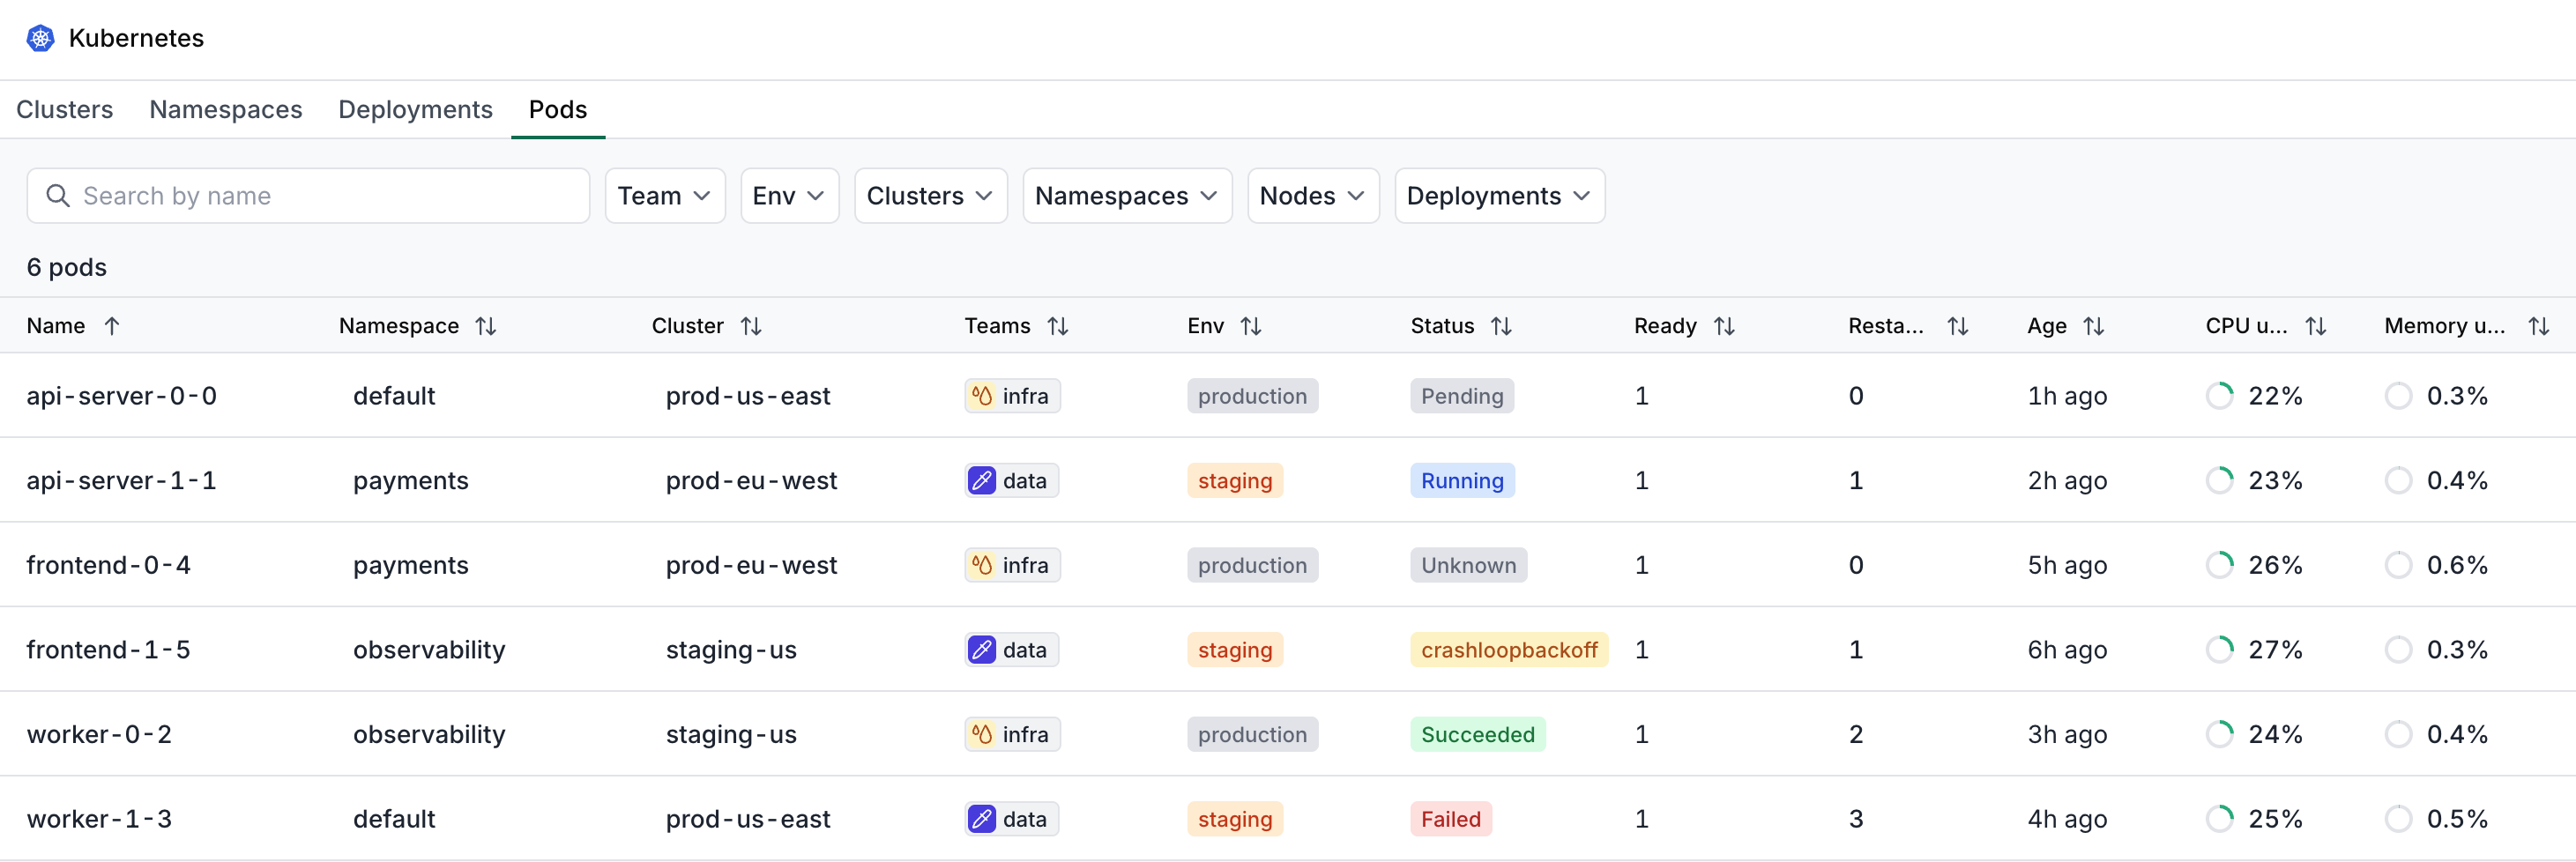
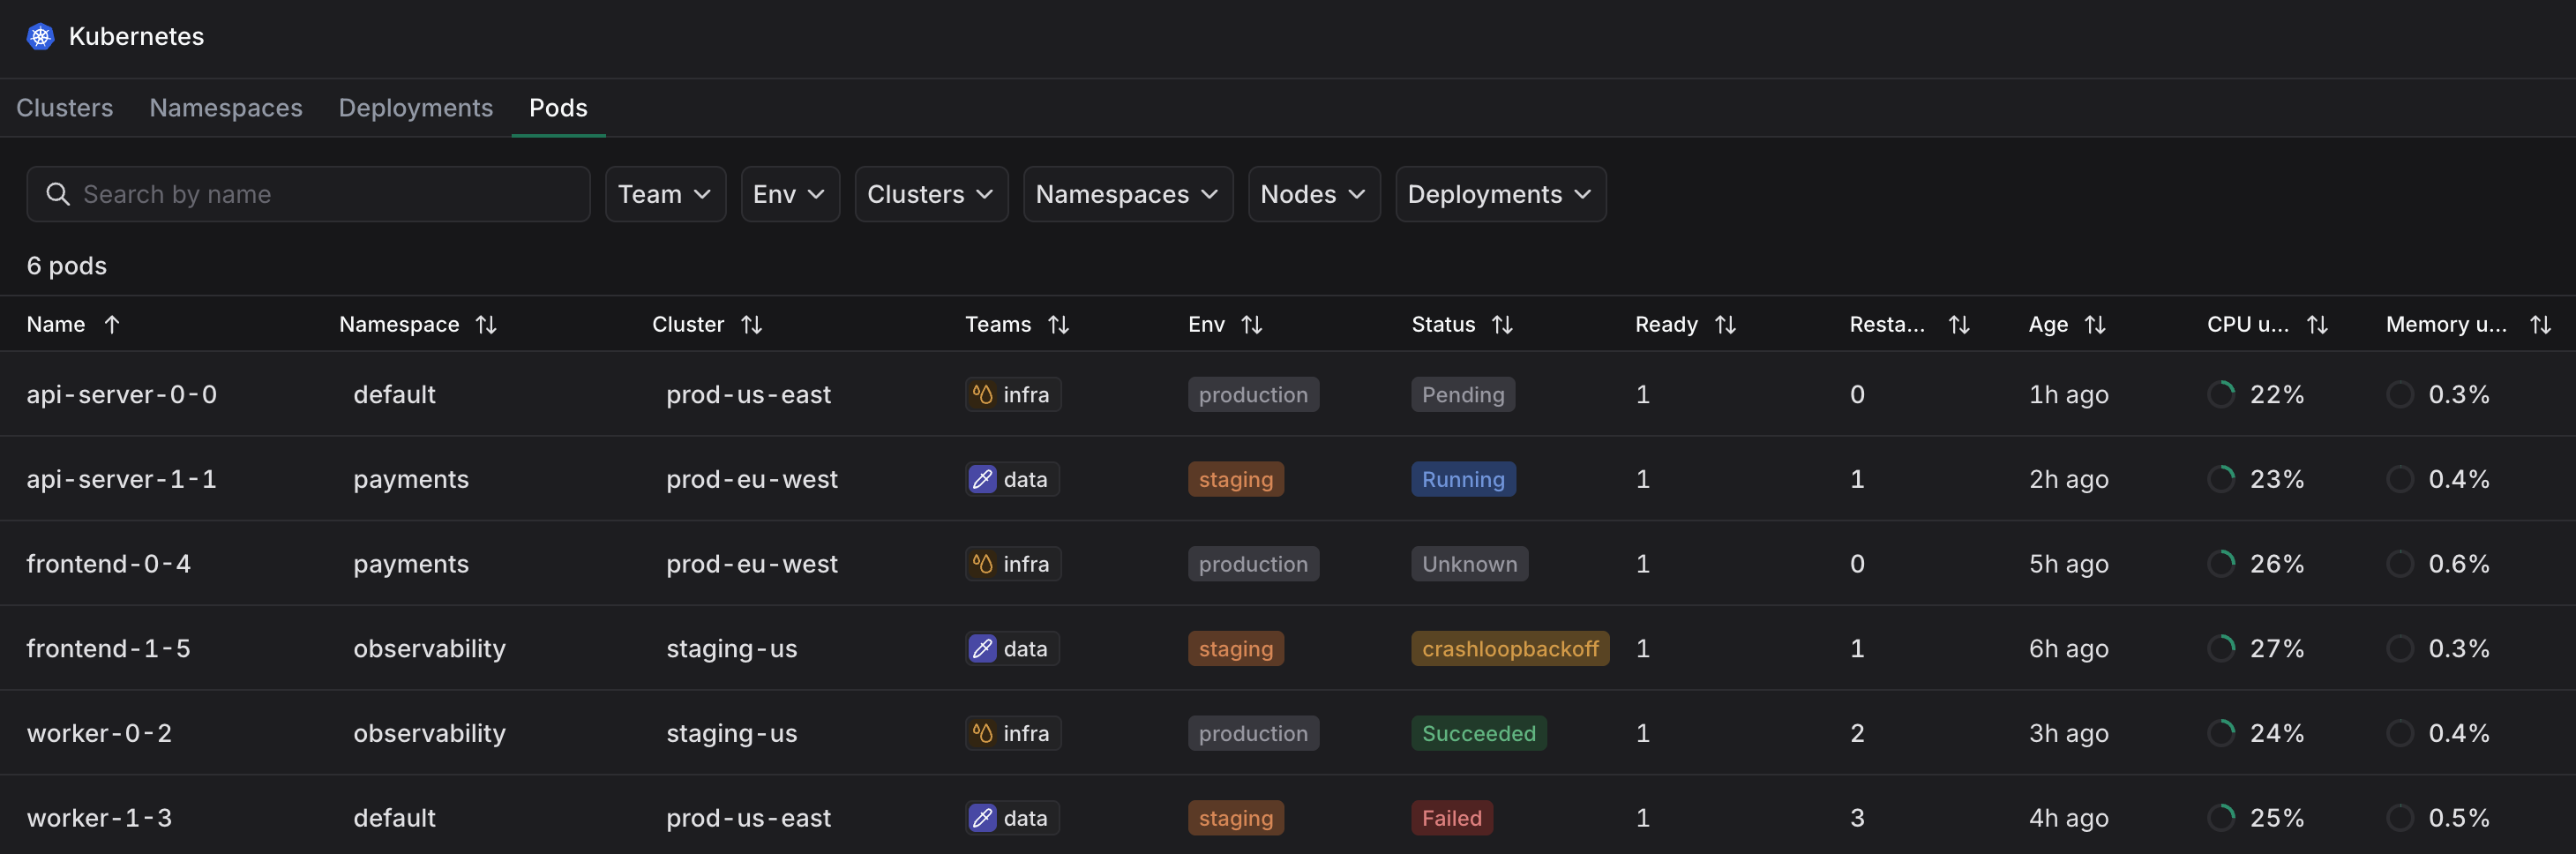
You are three hours into an incident, a Kubernetes node is spiking, your monitoring dashboard shows the metric, but the labels that tell you which tenant, deployment or region got dropped months ago to keep the bill down. Now you are hunting through logs instead of fixing the problem.

Tsuga removes the penalty for rich labels. Add whatever dimensions your systems need. The price per GB stays the same.

Hero image

Production infrastructure monitoring that scales economically

Infrastructure monitoring should tell you what is happening across your systems. Instead, the teams we talk to are shrinking retention windows, sampling time series, and dropping tags before incidents even happen. Not because they want to, but because keeping full observability is too expensive. That is a flaw in how these tools are built.

Here is what that looks like in practice.

Teams constrain dimensions upfront, before they know what future incidents will require. Then the incident happens and the context simply isn't there.

How Tsuga helps

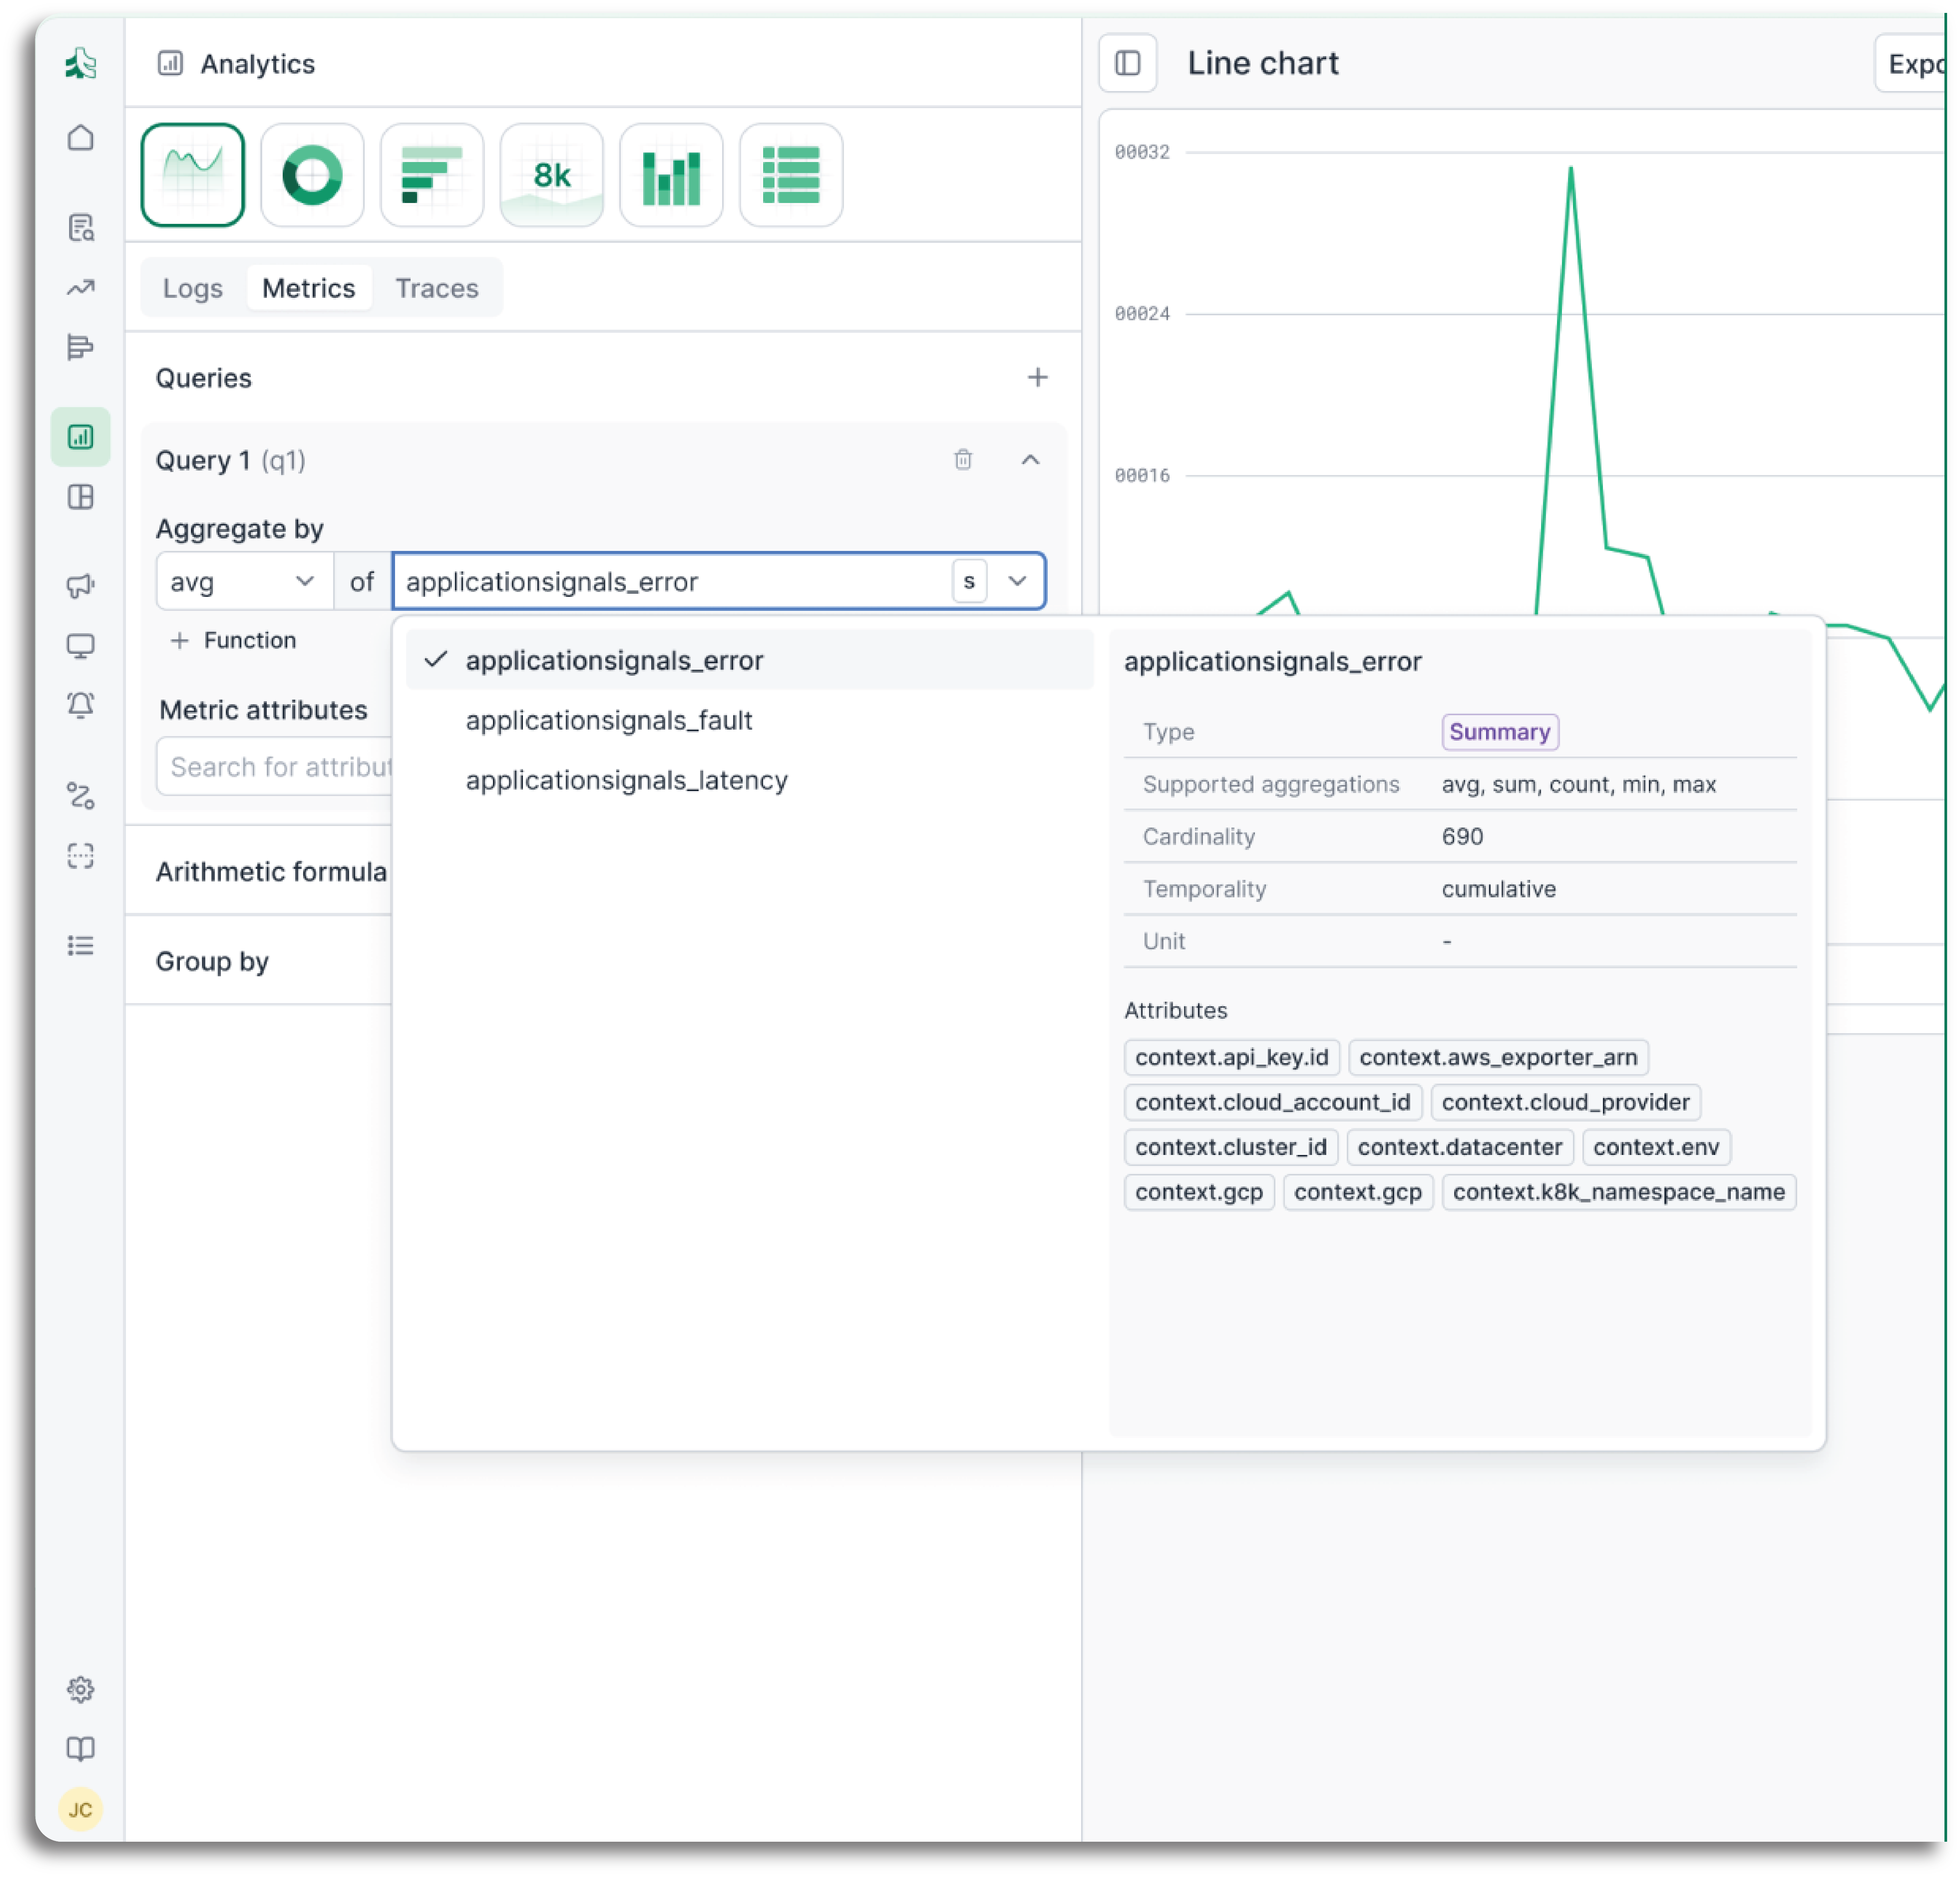
Tsuga has no cardinality limits. Add region, service, version, tenant, deployment - whatever dimensions your systems actually need. The pricing doesn't change.

Production infrastructure monitoring that scales economically

Infrastructure monitoring without the compromises

Tsuga delivers infrastructure monitoring inside your own cloud, priced by the gigabyte, with no cardinality limits, no proprietary lock-in, and full correlation across metrics, logs, and traces.

Why Tsuga is different

The way infrastructure monitoring is sold shapes the way teams instrument their systems. When tags cost extra, teams drop them. When hosts carry separate fees, teams under-monitor. Tsuga's model removes those distortions entirely.

One price per GB, no matter how many labels you add

Most infrastructure monitoring platforms charge by host, by container, by retention tier, or by the number of unique metric series. Each of those is a multiplier that makes your bill unpredictable and forces your team to make hard choices about what to keep. Tsuga charges one flat rate per gigabyte of ingested telemetry.

Your cloud, your data, your keys

Tsuga deploys the data plane inside your AWS account. Your metrics live in your S3 buckets, encrypted with your KMS keys. The control plane connects via mutual TLS for management and upgrades, but Tsuga never ingests or stores your data. For regulated industries, multi-tenant platforms, or any team that does not want operational data leaving their perimeter, this is infrastructure monitoring with sovereignty built in.

A forward-deployed engineer who works to lower your costs

Tsuga is software and a service, not just a dashboard you log into. Every customer gets a named field engineer for the lifetime of the account, plus direct access to the CTO. That engineer works inside your environment to optimise pipelines, retention, and access patterns. Because Tsuga does not profit from data bloat, the incentive is aligned.

Metrics designed to preserve meaning.

Modern systems are complex. Your metrics platform should help you understand that complexity, not force you to paper over it.

No cardinality limits

Add as many tags as your systems need. Region, service, version, tenant, deployment - keep all the dimensions that help you explain what's happening. You will not hit a hard limit or see your bill spike because a new label combination appeared.

Pricing that makes sense

One price per GB of ingested telemetry. No hidden multipliers. Metrics are also highly compressible, so the economics actually improve at scale. As your infrastructure grows, your cost per data point tends to fall rather than climb.

Open standards throughout

Built on OpenTelemetry and open collection. You keep using the tools you trust today, and your options stay open for tomorrow. If you ever need to move your data or change your pipeline, you are not extracting it from a proprietary format first.

Connected to logs and traces

Go from a metric anomaly to the services and changes behind it in one click. Metrics are the start of the investigation, not the end. The same platform handles your logs and traces, so you do not lose time switching tools or rebuilding context.

Your cloud, your metrics

The data plane runs in your environment - important for large Kubernetes estates, multi-tenant platforms, or anywhere data residency matters. Your metrics live in your buckets, encrypted with your keys, and never cross into a vendor's infrastructure.

One platform for everyone

Platform teams, engineering teams, leadership - they all need metrics, but for different reasons. Tsuga brings them into a shared model that works for all of them. Everyone sees the same data, filtered by the permissions and boundaries that make sense for their role.

Is Tsuga right for you?

Tsuga is purpose-built for a specific set of constraints. If your situation does not match them, we will tell you upfront.

Tsuga is a fit if you...

  • Spend over $100,000 per year on observability and your infrastructure monitoring bill is growing faster than your infrastructure
  • Need data sovereignty or residency compliance (GDPR, banking regulations, healthcare requirements)
  • Run large Kubernetes estates, multi-tenant platforms, or high-cardinality workloads where tag limits are a real constraint
  • Want to move off legacy on-prem tools but need a managed path to cloud
  • Value direct access to engineers and responsive feature development over self-serve ticketing

Tsuga is not a fit if you...

  • Are a small team with minimal observability spend and no compliance requirements
  • Prefer a fully self-hosted open-source stack that your own team manages end-to-end
  • Need a broad feature surface covering security monitoring, SIEM, or IT service management in the same tool

Frequently asked questions

You pay for the volume of telemetry you ingest, not for the number of hosts, containers, or unique metric series. Because metrics compress well, a large Kubernetes estate often generates less ingested volume than you would expect. A forward-deployed engineer works with you during onboarding to tune scrape intervals, aggregation rules, and retention so you are not paying to store noise.

What happens to my existing Prometheus or OpenTelemetry setup?

Own your observability

If your observability bill is growing faster than your infrastructure, or if telemetry leaving your cloud is a risk you cannot take, Tsuga is built for your constraints.