What is high cardinality in observability? Dimensions, metrics and cost trade-offs
Learn what high cardinality in observability means, what causes it, how it affects costs and performance, and the trade-offs teams face.
Quick summary
High cardinality is the growth of unique metric time series caused by dimensions such as regions, environments, customer IDs and deployment versions. It improves observability context but increases query complexity and costs. Most vendors manage it through limits, aggregation, sampling and pricing controls. Tsuga’s BYOC model keeps full-dimensional observability affordable and under customer control.
Is high cardinality really the problem in observability?
Most discussions about observability costs eventually point to high cardinality. Too many dimensions, too many time series and too much telemetry are often presented as the root cause of the problem.
The reality is more nuanced. Modern applications generate vastly more data than their predecessors, and much of that data is essential for understanding how complex systems behave.
In this Tsuga article, we explain what high cardinality really is and why it matters. We then explore its impact on performance, cost and observability visibility.
What are cardinality and dimensions in observability?
To understand high cardinality, you first need to understand how observability metrics are structured.
Every metric consists of a measurement and a set of dimensions, often called labels, attributes, or key-value tags. These dimensions provide the context that makes a metric useful. For example, an API latency metric becomes far more valuable when it includes tags such as service=checkout, environment=production, or region=eu-west.
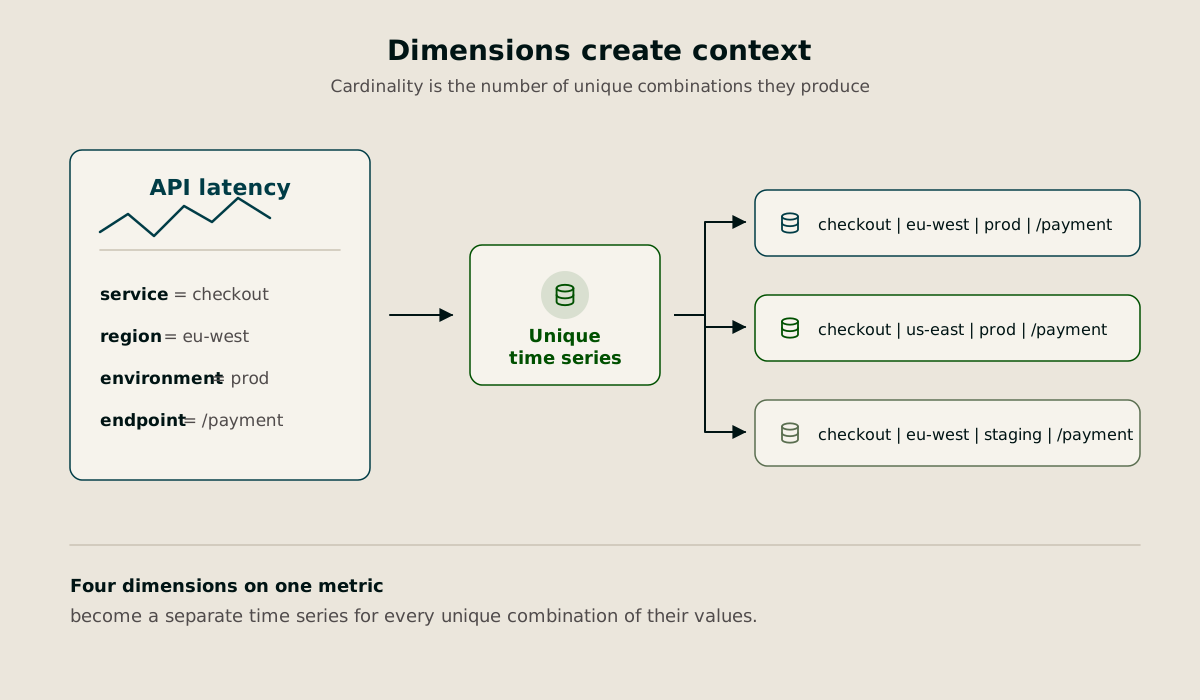
Without dimensions, metrics can tell you that something is wrong. With dimensions, they can help you identify where and why.
Cardinality refers to the number of unique metric time series created by those dimensions. Every unique combination of metric name and tag values generates a separate time series that the observability platform must store, index, and query.
For example, a request latency metric tagged with:
Service
Region
Environment
Endpoint
will create a new time series for every unique combination of those values.
In a nutshell, dimensionality is the number of key-value tags attached to a metric, while cardinality is the number of unique combinations those tags create.
What causes high cardinality in modern observability systems?
High cardinality is often the natural result of modern software architecture. As systems become more distributed, dynamic, and instrumented, the number of unique metric combinations grows rapidly.
Microservices multiply telemetry
In a monolithic application, there may be only a handful of services and infrastructure components to monitor. Modern environments look very different.
A typical microservices deployment can include:
Dozens of services
Multiple deployment versions
Hundreds of containers or pods
Separate development, staging, and production environments
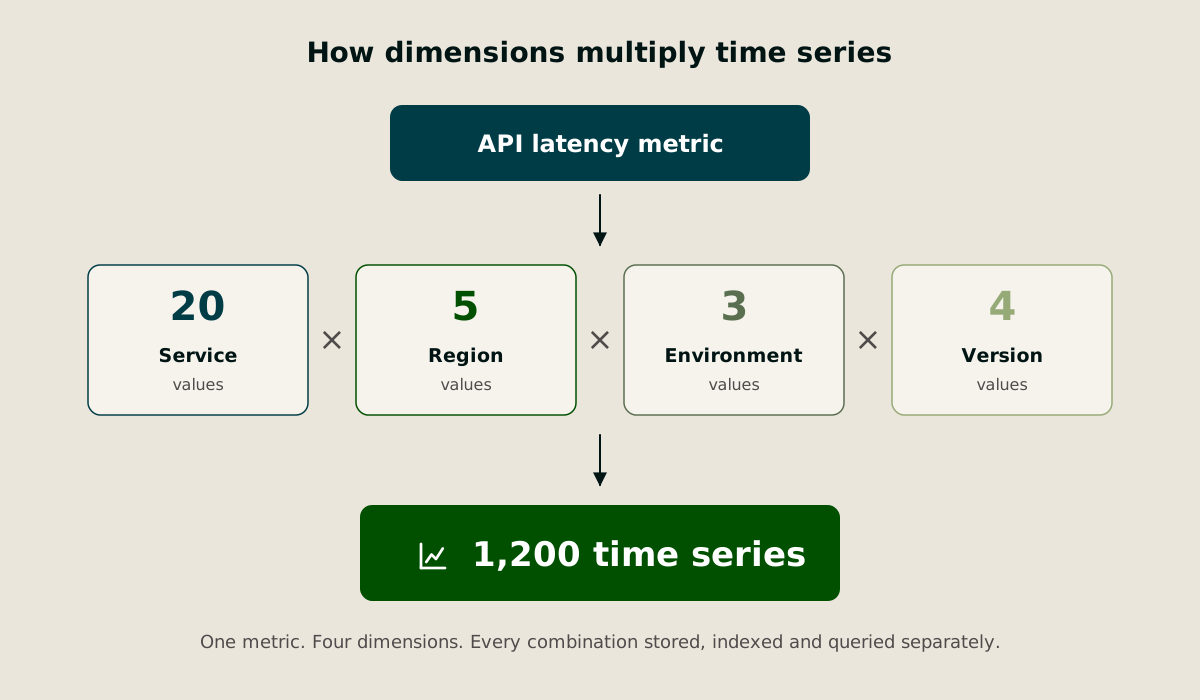
Each service generates its own metrics and dimensions. What begins as a simple latency metric can quickly expand into thousands or millions of unique time series once service names, versions, endpoints, and infrastructure identifiers are included.
Dynamic infrastructure creates constant change
Kubernetes and other orchestration platforms add another layer of complexity.
Containers are created, scaled, replaced, and terminated continuously. Every new pod, container ID, image hash, or workload identifier introduces additional metric combinations. Even when the workload itself remains unchanged, the infrastructure supporting it may generate entirely new time series.
This creates two challenges:
More unique series overall
Constant churn as old series disappear and new ones are created
As a result, observability systems must spend more resources indexing, storing, and querying telemetry that may only exist for a short period.
OpenTelemetry increases visibility and cardinality
OpenTelemetry has made instrumentation far more accessible, which is a major benefit for engineering teams.
The challenge is that every metric attribute can potentially become a dimension. Resource attributes such as service name, host, deployment version, namespace, or runtime information often get attached to metrics automatically.
A single instrumentation change can dramatically increase the number of metric series being generated.
User and session identifiers create explosive growth
Some dimensions have virtually unlimited possible values.
Common examples include:
user_id
session_id
request_id
tenant_id
trace_id
These fields provide valuable troubleshooting context, but each new value creates another unique series.
Environment and region tags multiply everything
Tags such as environment, region, availability zone, deployment version, and experiment group are often essential for debugging production systems.
The important detail is that these dimensions multiply existing series rather than simply adding to them.
A latency metric broken down by endpoint, region, environment, and customer segment creates far more combinations than many teams expect.
Why is high cardinality difficult to manage?
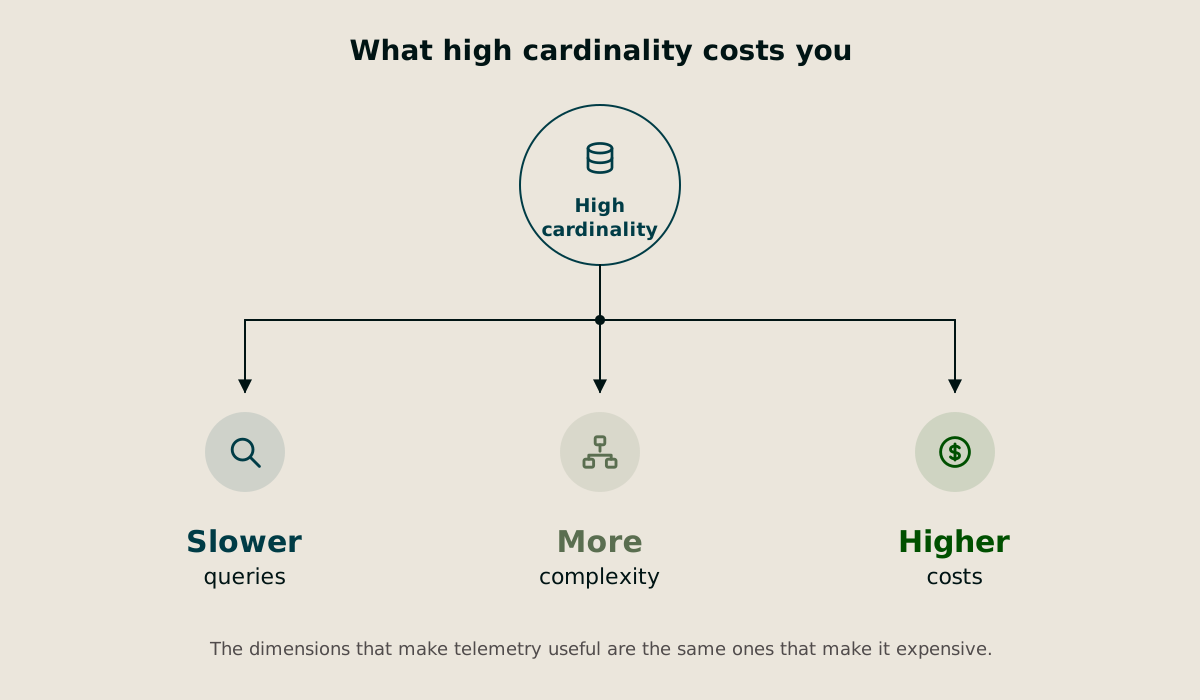
High cardinality creates a difficult balancing act. The same dimensions that make observability data useful for troubleshooting also make that data harder and more expensive to store, query, and analyze.
Query performance suffers as series counts grow
Every unique metric series must be indexed and searched when a query runs.
At smaller scales, this is rarely a problem. As environments grow from thousands of series to millions, query execution becomes significantly more complex. Dashboards take longer to load, ad hoc investigations slow down, and queries that once returned results in seconds can begin timing out.
This becomes particularly painful during incidents.
When engineers are trying to identify the root cause of a production issue, they need to explore data quickly. Slow queries introduce friction at exactly the moment when fast answers matter most.
More context creates more analytical complexity
High cardinality improves visibility because it preserves context. Teams can analyze performance by customer, region, deployment version, device type, or other dimensions.
The challenge is that this additional context increases the complexity of analysis.
For example, an API may appear healthy when viewed as a global average. However, a closer breakdown might reveal that:
Enterprise customers in a specific region are experiencing poor performance
A newly deployed version is generating errors
One payment provider is failing for a subset of users
Without granular dimensions, these issues remain hidden. With them, engineers gain deeper insight but must manage a much larger and more complex dataset.
Costs increase across the observability stack
High cardinality also has a direct financial impact.
Every new time series consumes resources across the observability pipeline:
More memory for indexing
More storage for retention
More compute for queries
More infrastructure to support ingestion and processing
A single additional dimension may multiply the total number of metric series many times over. Adding customer IDs, tenant IDs, or session identifiers can transform a manageable metric into millions of unique series.
How observability vendors handle high cardinality and the trade-offs involved
Most observability vendors recognize that high cardinality places pressure on storage, indexing, and query infrastructure. Their response is usually to introduce controls that keep those costs manageable.
Common approaches include:
Cardinality limits
Per-custom-metric or per-series pricing
Indexing restrictions
Usage quotas for high-cardinality data
These approaches can help control costs, but they do not remove the underlying tension between visibility and affordability.
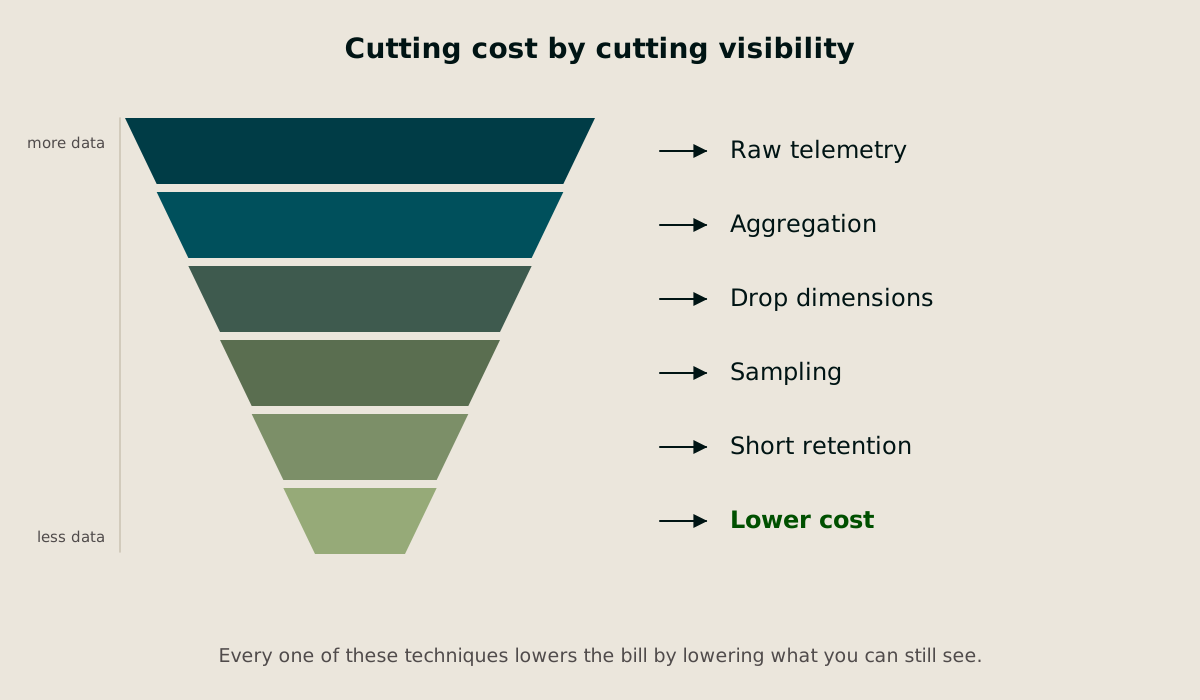
As a result, engineering teams often need additional workarounds.
Aggregation
This is the most common workaround. Rather than storing every dimension, teams combine data into broader groups before it is queried. For example, they may retain regional latency metrics while removing host-level or instance-level granularity.
This reduces cardinality, but it also limits how deeply engineers can investigate a problem. Teams can identify that an issue exists within a region, but may struggle to determine which specific service instance is responsible.
Dropping dimensions
Another common approach is dropping dimensions altogether.
High-cardinality fields such as:
User IDs
Session IDs
Request IDs
Tenant identifiers
are frequently excluded from metrics pipelines. This keeps series counts under control, but it can remove the context needed to understand which customers, deployments, or transactions were affected by an issue.
When an incident occurs, the very dimension that could have helped identify the root cause may no longer be available.
Sampling
Sampling means collecting only a percentage of telemetry data instead of capturing every event. This reduces ingestion, storage, and query costs, making it easier to manage large volumes of observability data. However, it also introduces blind spots. Rare failures, edge cases, and customer-specific issues can be missed because the relevant events were never retained.
Downsampling and shorter retention
Teams often reduce data resolution over time or keep data for shorter periods.
For example, one-minute metrics may be retained for a few days before being rolled up into hourly averages. Some organizations also shorten retention windows to reduce storage costs.
The trade-off is that historical investigations become harder because important detail is no longer available.
How Tsuga helps
Tsuga runs inside your cloud through a Bring Your Own Cloud (BYOC) architecture. Instead of moving logs, metrics and traces into a vendor-controlled environment, observability infrastructure is deployed within your AWS, Azure or Google Cloud account. Telemetry remains under your control while Tsuga provides the management and user experience layer.
This changes the economics of high-cardinality observability.
Cardinality is not a vendor revenue stream
With traditional SaaS observability platforms, pricing often increases as the number of custom metrics, indexed dimensions or active time series grows. As a result, high cardinality frequently becomes a cost-management problem.
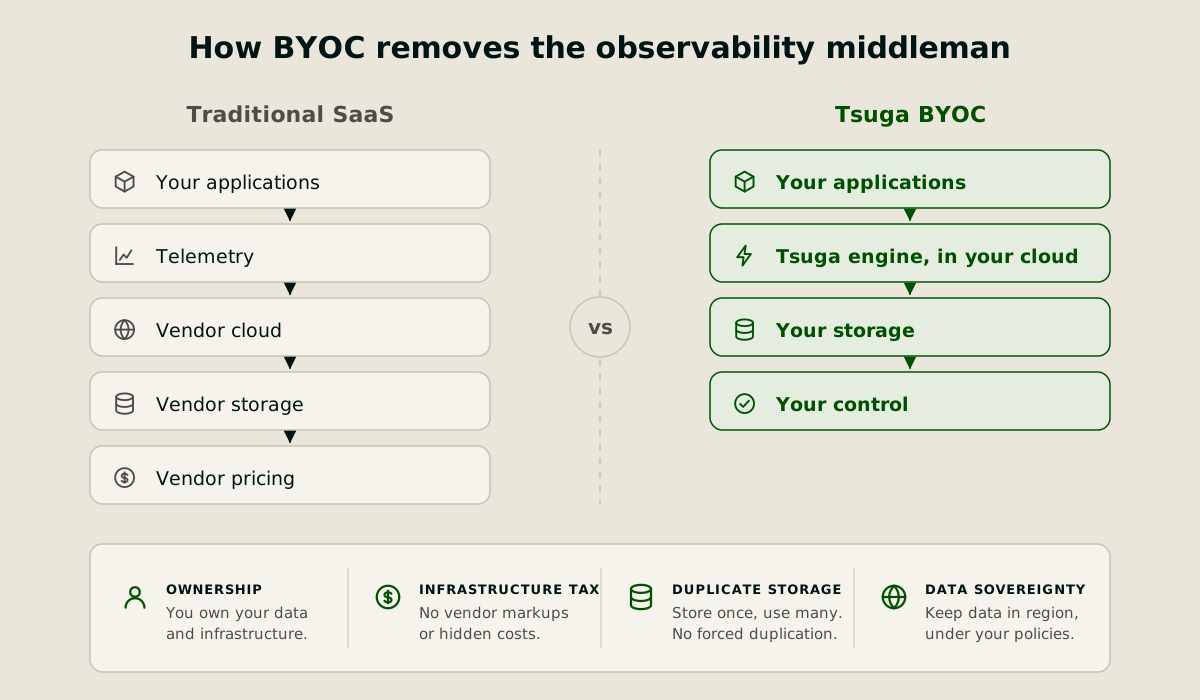
Because Tsuga runs on infrastructure you already own, cardinality is not a line item the vendor profits from. Storage and compute costs are paid directly to your cloud provider rather than being marked up through per-metric or per-series pricing models.
That means teams can retain valuable dimensions without constantly evaluating whether a label will increase next month’s bill.
Full-dimensional metrics stay affordable
High-cardinality dimensions often provide the context engineers need during incidents. Customer IDs, tenant IDs, deployment versions, regions and environments can reveal patterns that disappear in aggregated views.
With Tsuga, teams are not forced into the usual trade-offs, such as:
Dropping dimensions to reduce costs
Aggressively sampling telemetry
Shortening retention periods
Pre-aggregating data before analysis
Instead, they can preserve richer context across logs, metrics and traces while maintaining predictable costs.
Reduce metric cardinality with automated quality reports
Tsuga helps teams reduce metric cardinality with automated quality reports that detect high-cardinality tags, highlight unused metrics, and show where optimization will have the biggest impact. Instead of guessing which dimensions to remove or which metrics to clean up, platform and observability teams get a clear path to control cardinality, reduce noise, and keep the metrics that matter.
Dedicated engineering support
Technology alone does not solve observability challenges. Tsuga customers work with a dedicated engineer who helps optimize instrumentation, retention policies and overall telemetry strategy.
Because Tsuga does not profit from data growth, the incentives are aligned. The focus is on helping teams improve visibility, control infrastructure costs and retain the data that matters most.
Built for modern systems
Microservices, Kubernetes, OpenTelemetry and AI-generated workloads continue to increase telemetry volumes. Tsuga is designed around the assumption that high-cardinality data is normal, not exceptional.
Rather than treating cardinality as something that must always be restricted, the platform allows organizations to keep the dimensions that matter, maintain data sovereignty and scale observability using their own cloud economics.
Frequently asked questions (FAQs)
How can I estimate the impact of adding a new dimension?
Each new dimension multiplies the number of possible time series. For example, adding a customer_id tag with 10,000 values to a metric already segmented by 50 endpoints and 5 regions creates 2.5 million series.
Does high cardinality affect logs, traces and metrics equally?
No. Logs and traces are designed to handle highly unique data such as request IDs, session IDs and trace IDs. Metrics are different because every unique label combination creates a separate time series that must be stored, indexed and queried. This is why high cardinality is primarily a metrics challenge.
What is the difference between cardinality and churn?
Cardinality measures how many unique time series exist. Churn measures how quickly new series are created and old ones disappear. High cardinality increases memory and index requirements, while high churn creates additional pressure on ingestion, compaction and garbage collection processes.
How can I identify the biggest sources of cardinality growth?
Review metrics with the highest number of unique label combinations. Common contributors include user_id, customer_id, session_id, request_id, pod_name and dynamic URL paths. Cardinality reporting tools can help pinpoint the labels responsible for most growth.
Can short retention make high-cardinality data more manageable?
Yes. Many teams retain detailed telemetry for a short period, often 24–48 hours, and then aggregate or remove high-cardinality dimensions. This reduces costs while preserving enough detail for recent incident investigations, though it limits long-term analysis.