Log sampling explained: strategies, benefits and trade-offs for modern observability
Learn what log sampling is, how common sampling strategies work, their benefits, trade-offs, and when retaining full telemetry makes more sense.
Quick summary
Log sampling reduces observability costs by storing only a subset of logs, helping teams manage growing telemetry volumes and improve query performance. While effective for cost control, it can introduce blind spots, bias, and debugging challenges. The right strategy depends on your requirements. Tsuga changes the economics of observability, making full-fidelity telemetry retention a practical option rather than a budget-driven compromise.
Is log sampling helping or hurting observability?
Modern systems generate an enormous volume of logs, metrics, and traces. While that data is essential for troubleshooting, performance monitoring, and security investigations, storing and analysing everything can quickly become expensive. That is why many engineering teams turn to log sampling.
In this Tsuga piece, we explain what log sampling is, how the most common sampling strategies work, where sampling delivers real value, and the trade-offs teams should understand before deciding how much telemetry to keep.
What is log sampling?
Log sampling is the practice of keeping only a subset of log events instead of storing every log generated by a system. The goal is to reduce data volume while preserving enough information for troubleshooting, monitoring, and incident investigation.
As applications scale, log volume can grow into billions of events per day. Many of those events are repetitive and provide little additional value. Sampling helps teams control storage, ingestion, and query costs without completely sacrificing visibility.
Note that filtering and sampling serve different purposes, but they are often used together. Filtering decides which categories of logs should always be kept or discarded based on predefined rules. Sampling then reduces the volume of the remaining logs by keeping only a percentage of them.
Consider a checkout service handling 10,000 requests per minute. Each request generates:
1 access log
3 application logs (validation, payment processing, confirmation)
1 database query log
Total: 50,000 log events per minute = 72 million per day
With 10% probabilistic sampling:
5,000 logs per minute captured = 7.2 million per day
Storage reduced by 90%
Query performance improves proportionally
Cost: instead of paying for 72M events, you pay for 7.2M
Why teams sample logs
A response to growing telemetry volumes
The primary reason teams sample logs is cost control.
Modern applications generate vast amounts of telemetry. A busy API, Kubernetes cluster, or AI-powered workload can produce millions of log events every day. As data volume grows, so do ingestion, storage, indexing, and retention costs.
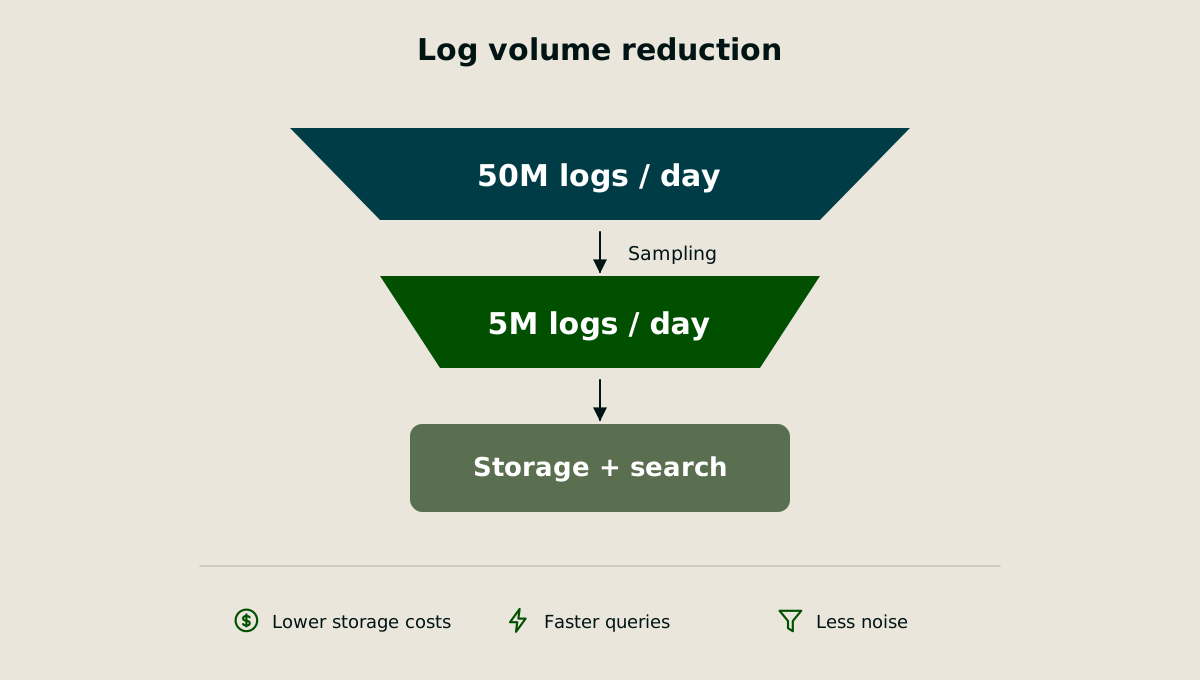
For organizations using usage-based observability platforms, logging can quickly become one of the largest infrastructure expenses. Sampling reduces the amount of data sent downstream, helping teams keep costs manageable while retaining enough information for troubleshooting and analysis.
Faster searches and investigations
Sampling also improves query performance. With fewer log records to process, dashboards load faster and searches complete more quickly. During incidents, engineers spend less time waiting for queries and more time identifying root causes.
Better signal-to-noise ratio
Large systems often generate huge volumes of repetitive events such as health checks, successful requests, and routine application activity. When every event is stored, important signals can become buried in noise. Sampling helps teams focus on patterns and anomalies that matter most.
More predictable operations
Without controls, sudden increases in traffic can dramatically increase observability costs and place additional strain on logging infrastructure. Sampling provides a predictable way to manage volume before collectors, storage systems, or query engines become overloaded.
Common log sampling strategies
There is no single sampling strategy that works for every system. The right approach depends on traffic volume, debugging requirements, and cost constraints.
Note that some of these strategies (head-based, tail-based, and hash-based) originate in distributed tracing and apply to logs when those logs carry trace context.
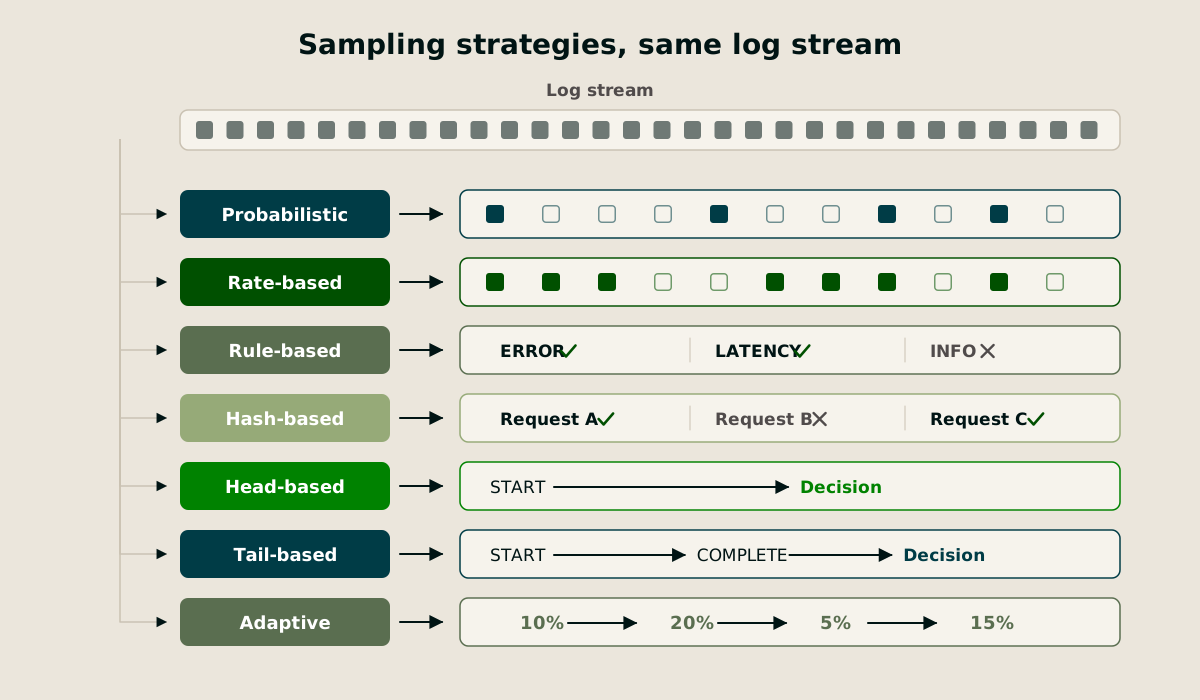
1. Probabilistic sampling
Probabilistic sampling keeps logs based on a fixed percentage. For example, a 10% sampling rate means roughly one in every ten log events is retained.
This is the simplest and most widely used approach because it is easy to implement and scales well. Many teams apply different rates to different log levels, such as sampling debug logs aggressively while retaining all error logs.
2. Rate-based sampling
Rate-based sampling limits the number of logs collected within a given time period. Instead of keeping a percentage of events, the system might keep a fixed number of logs per second or minute. This approach is useful when traffic is unpredictable because it prevents sudden spikes from overwhelming logging infrastructure and driving up costs.
3. Rule-based sampling
Rule-based sampling uses predefined conditions to determine what should be retained.
Common examples include:
Keep 100% of error logs
Keep all requests with high latency
Sample successful requests at 10%
Apply different rates by service or environment
This approach provides greater control and helps preserve the data most valuable during investigations.
4. Hash-based sampling
Hash-based sampling makes deterministic decisions using a unique identifier such as a request ID or trace ID.
The key advantage is consistency. If a request is selected, all related logs across multiple services are retained. This makes it much easier to reconstruct complete user journeys and distributed traces.
5. Adaptive sampling
Adaptive sampling dynamically adjusts sampling rates based on traffic patterns, system load, or error rates. It helps balance visibility and cost in environments where workloads change constantly.
Note: Some sampling techniques originate in distributed tracing rather than logging. For example, head-based and tail-based sampling determine whether an entire trace is retained, ensuring all spans from the same request follow a consistent sampling decision.
How to implement log sampling
There are two common places to implement log sampling: inside the application itself or within a central collector such as OpenTelemetry Collector, Vector, or Fluent Bit.
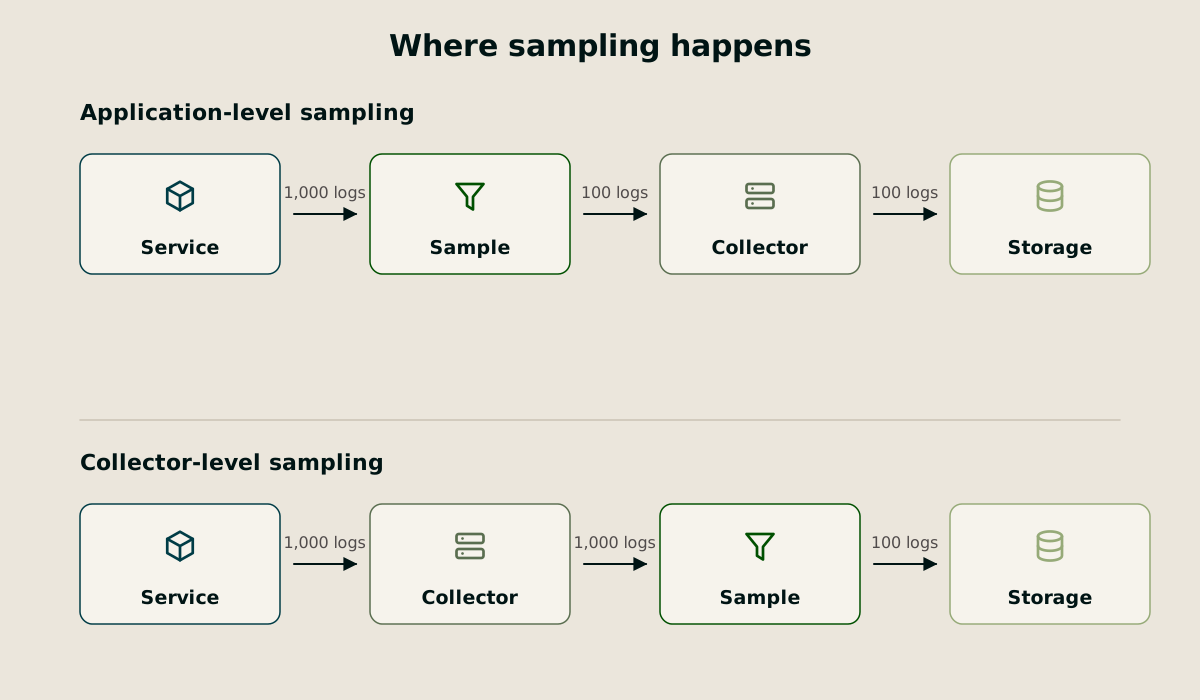
1. Application-level sampling
This happens before logs leave the service. Logging frameworks can apply sampling rules based on log level, category, event type, or trace context.
For example, a team might:
Keep 100% of error logs
Sample 10% of informational logs
Sample 1% of debug logs
This approach reduces ingestion volume immediately, which lowers network, storage, and observability costs. It also gives developers fine-grained control over individual services.
2. Collector-level sampling
This applies policies after logs have been emitted. Instead of configuring every service separately, teams manage sampling rules in one place.
Common collector rules include:
Sample 10% of routine traffic
Keep all error and security events
Prioritize slow requests or high-latency traces
Apply different rates for different services
This approach works particularly well in large microservices environments because policies remain consistent regardless of programming language or framework.
Many organizations use a hybrid approach. Lightweight sampling at the application layer reduces volume early, while collector-level policies provide centralised control and ensure critical events are preserved.
Here is a good starting point: keep all errors, aggressively sample low-value logs, then adjust rates based on cost, query performance, and incident response needs.
The trade-offs of log sampling
Log sampling reduces costs and improves performance, but it comes with a price. Every sampling decision creates a trade-off between efficiency and visibility.
You might lose the event that matters
This is the biggest risk. The log entry that explains an outage, security incident, or customer-facing bug may be one of the events that gets discarded.
Consider an intermittent issue that affects only 1 in 10,000 requests. At a 10% sampling rate, you’ll only capture a fraction of those occurrences. The lower the sample rate, the harder it becomes to gather enough evidence to identify patterns and determine root cause.
This problem becomes even more challenging in distributed systems. If different services make different sampling decisions, engineers can end up with fragmented traces and incomplete context during an incident.
Sampled data can introduce bias
Sampling works best when the retained data accurately represents the whole system. In practice, that is not always the case.
Common issues include:
Missing short-lived traffic spikes
Under-representing rare but important events
Capturing incomplete request journeys across services
Creating blind spots for specific users, regions, or workloads
As systems become more complex, these gaps become harder to spot.
“Good enough” can become the default
Many teams start sampling to control costs. Over time, reduced visibility becomes normal.
The danger is that engineers begin making decisions based on partial information. During incidents, the missing data is often the data they need most. Lower observability costs can sometimes lead to higher debugging costs through longer investigations and slower resolution times.
Sampling adds operational overhead
Effective sampling is not a one-time configuration.
Teams must:
Define appropriate sampling rules
Review rates as traffic patterns change
Coordinate policies across services
Monitor whether critical events are still being captured
Sampling requires ongoing maintenance, because the goal is not simply to reduce data volume, but to do so without compromising your ability to understand what is happening in production.
How Tsuga helps
Throughout this article, we’ve seen that log sampling is fundamentally a trade-off. Teams reduce telemetry volume to control observability costs, accepting that they may lose some visibility in return.
Tsuga changes that equation.
Sampling becomes a technical decision, not a financial one
With most SaaS observability platforms, every additional gigabyte ingested and retained increases the bill. As telemetry volumes grow, teams often respond by lowering retention periods, increasing sampling rates, or dropping entire categories of logs simply to stay within budget.
Tsuga’s Bring Your Own Cloud (BYOC) architecture removes much of that economic pressure. Because the platform runs inside your own cloud environment, you are not paying a vendor markup on every gigabyte of telemetry you retain.
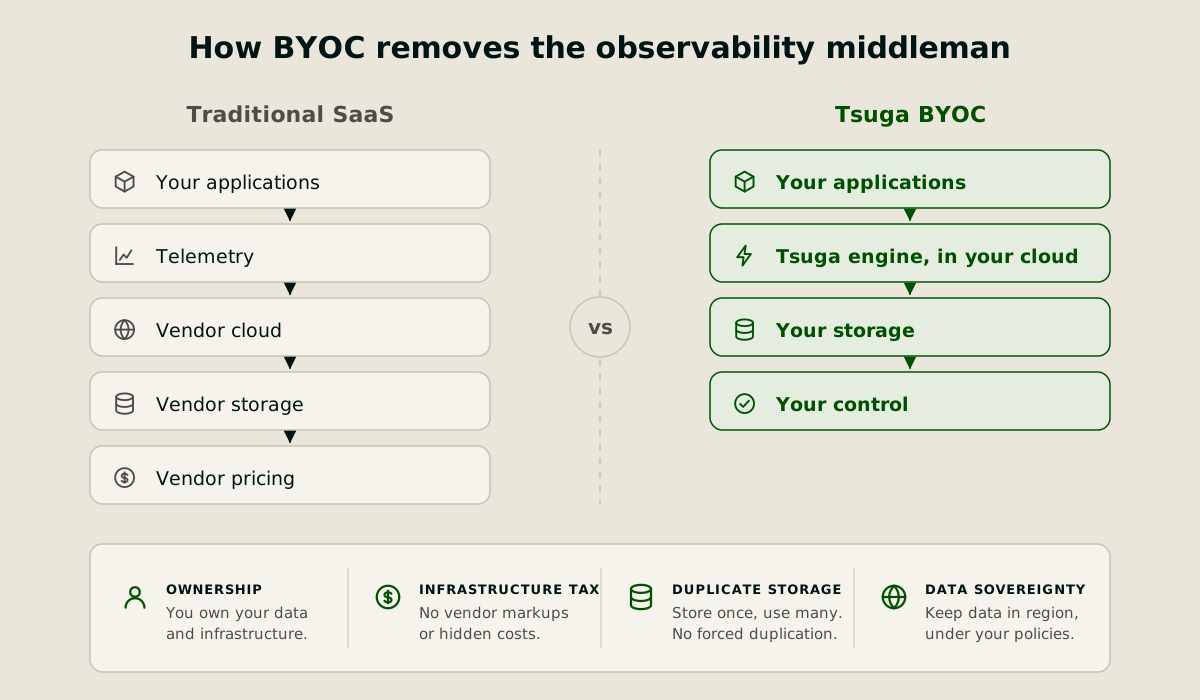
Retain more of the telemetry that matters
Lower infrastructure costs allow teams to retain substantially more logs, metrics, and traces without unpredictable observability bills.
Instead of deciding whether they can afford to keep a particular dataset, engineers can make retention and sampling decisions based on operational requirements, compliance obligations, and investigation needs.
For some workloads, sampling will still make sense. For others, retaining complete telemetry becomes a practical option rather than a luxury.
Better visibility without vendor lock-in
Tsuga is built on OpenTelemetry and open data formats, with telemetry remaining inside your own cloud environment.
This gives organizations full ownership of their observability data while making it easier to meet governance requirements, integrate with data lakes and AI workflows, and evolve their tooling over time without being locked into proprietary storage or pricing models.
Guidance beyond the platform
Choosing appropriate sampling and retention policies depends on workload characteristics, regulatory requirements, and operational goals.
Tsuga’s forward-deployed engineers work with customers to design telemetry pipelines and retention strategies that balance visibility, performance, and cost. Because Tsuga’s business model is not tied to ingesting more data, its incentives remain aligned with helping customers keep the data they actually need.
Frequently asked questions (FAQs)
Does log sampling affect compliance requirements?
It can. Some regulations and internal policies require certain logs to be retained in full, particularly security, access, and audit logs. A common approach is to exempt compliance-critical logs from sampling while applying sampling only to lower-value operational data.
How often should I review my sampling configuration?
Review sampling rules at least quarterly and whenever traffic patterns change significantly, such as after major feature releases, infrastructure changes, or traffic spikes.
How do I know if my sampling rate is too low?
A sampling rate is likely too low if engineers regularly struggle to find the data needed during incident investigations. Start by retaining all error logs and sampling lower-priority logs conservatively. Review incident investigations regularly and adjust rates if important information is being missed.
What is the difference between log sampling and log retention?
Sampling determines which logs are collected and stored in the first place. Retention determines how long stored logs remain available before they are deleted. Sampling reduces data volume, while retention manages storage duration.
What happens to my sampled logs if I switch observability vendors?
With open formats and open storage (S3, GCS), you own the data regardless of vendor. Unlike proprietary SaaS platforms that lock data in their indexes, open log management means your sampled (or full) logs remain accessible.