Lexicon · Guide
We reviewed 10 AWS monitoring tools engineers actually use
Ten AWS monitoring tools compared by how each connects to AWS, what it monitors and how it charges, so you can see which one fits your team and your data.
Quick summary
The right AWS monitoring tools for your team depend less on feature lists than on where your telemetry lives, how the bill grows and how much setup you can absorb. We compared ten of them: Amazon CloudWatch, Tsuga, Datadog, Dynatrace, Grafana Cloud, New Relic, SigNoz, Splunk Observability Cloud, Elastic Observability and Better Stack. Each suits a different AWS setup, and Tsuga is the one built for teams whose telemetry has to stay inside their own AWS account, through a bring your own cloud (BYOC) deployment.
The 10 AWS monitoring tools we reviewed
Amazon CloudWatch
Amazon CloudWatch is the monitoring service built into AWS. It collects metrics, logs and traces from more than 30 AWS services, so if you run EC2, Lambda, RDS, ECS or EKS you get visibility without installing separate agents.
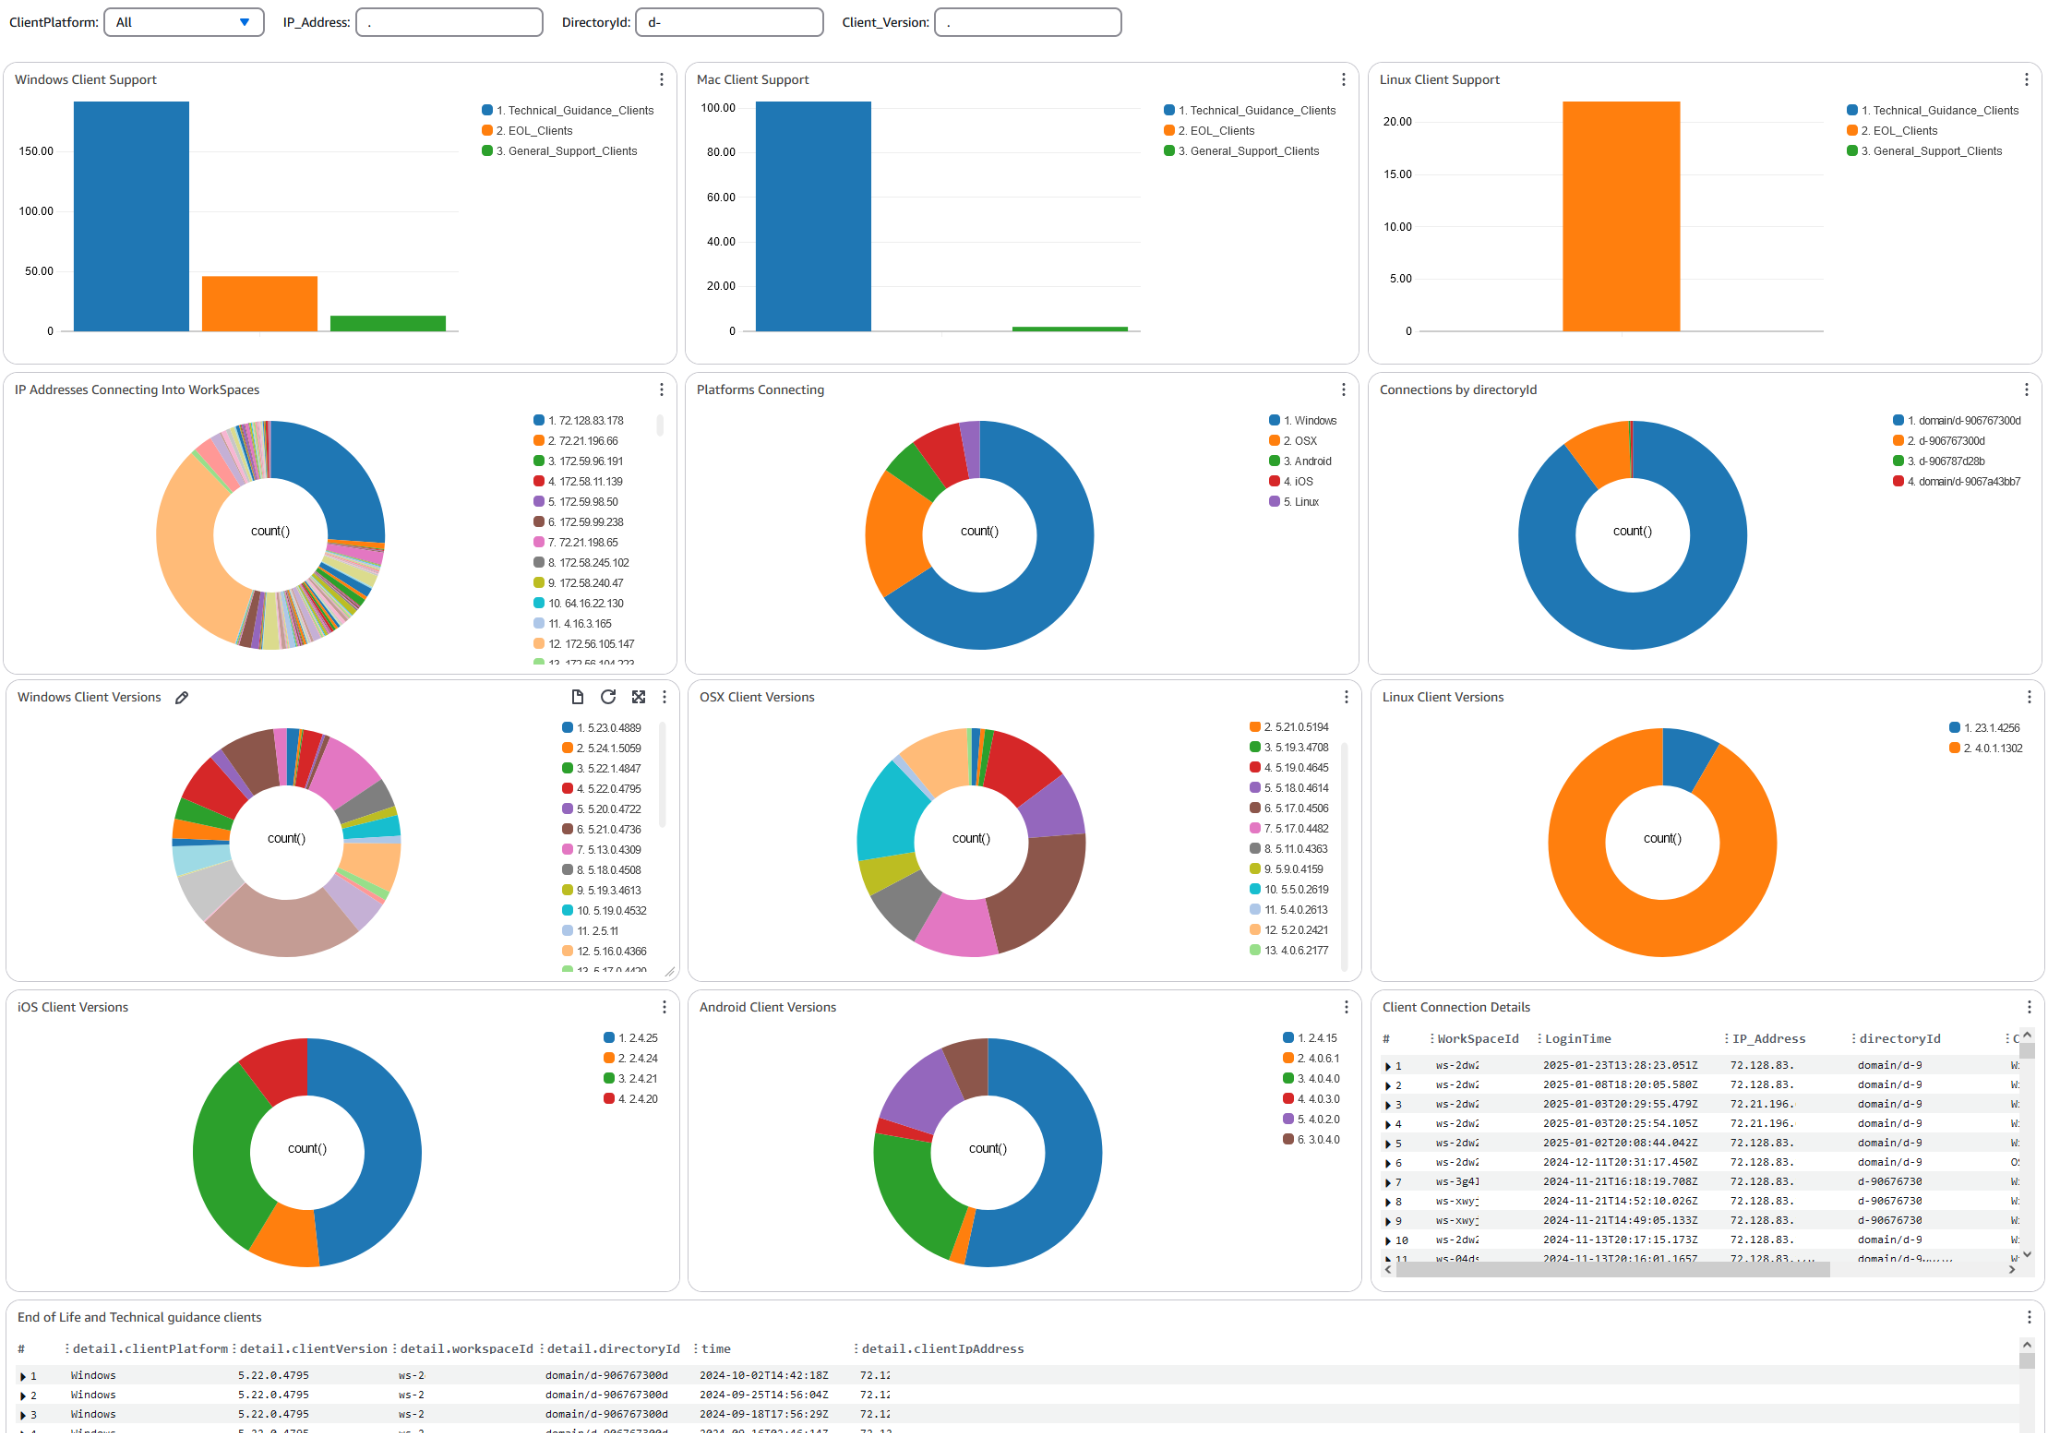
Because CloudWatch is part of AWS, it connects infrastructure and application signals with the account structure and AWS Identity and Access Management (IAM) context your team already uses. That shortens the path from an alarm to its resource.
Key features
Automatic dashboards: CloudWatch creates dashboards for many AWS services, including EC2 fleets and RDS clusters.
Container Insights: Collects metrics at the cluster, node, pod and container level for ECS and EKS, helping you find restarts and resource bottlenecks in containerized workloads.
Cross-account observability: Lets a central account view metrics, logs and traces from linked accounts, which is useful when you manage several AWS accounts.
Application Signals: Instruments distributed applications automatically to map service dependencies and track service level objectives (SLOs) without code changes.
Anomaly detection alarms: Uses machine learning to learn expected metric ranges, which raises less noise than static thresholds when traffic patterns change.
Pricing and rating
There is no upfront commitment or minimum fee. You pay monthly for what you use, with a small free tier, and beyond it logs, metrics, alarms, dashboards and application observability are each billed separately. On G2 it is rated 4.3 out of 5, from around 404 reviews.
Best for
CloudWatch suits teams running mostly AWS-native workloads that want monitoring built into their existing AWS accounts and IAM structure. It becomes harder to live with once your estate reaches beyond AWS, or once you want to query telemetry from several accounts and services together in one place.
Tsuga
We deploy our observability platform directly inside your AWS account instead of sending telemetry to a separate vendor cloud. Logs, metrics and traces are collected, indexed and stored in your own S3 buckets on your own compute, in infrastructure you control.
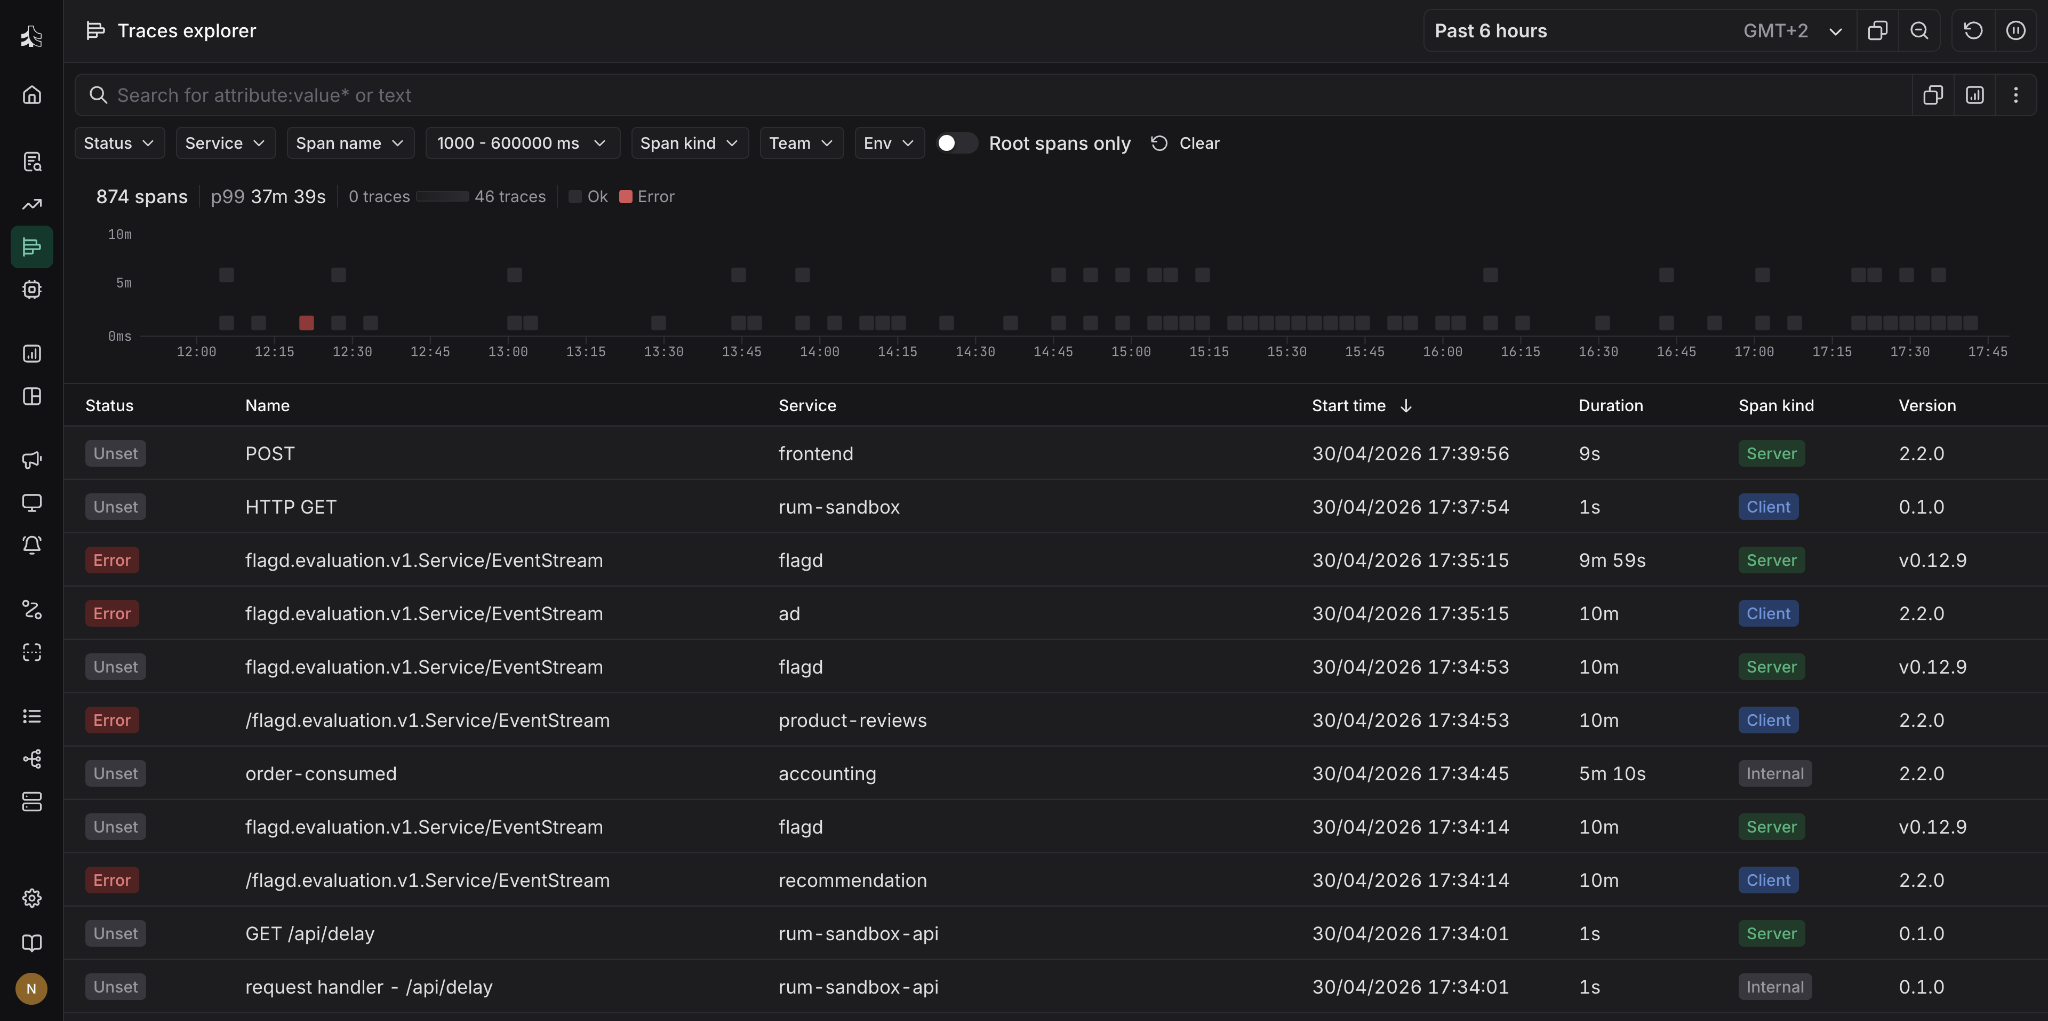
We manage the platform remotely, including deployment, upgrades and scaling, so your team gets a managed monitoring experience without giving up control over where your data is stored. Managed by Tsuga. Owned by you.
Key features
Data plane in your VPC: Ingestion, indexing and storage run inside your own AWS virtual private cloud (VPC), with data encrypted under your own AWS Key Management Service (KMS) keys.
Costs on your own AWS bill: Storage and compute are billed directly to your AWS account, so the cost of keeping telemetry shows up on the bill you already manage.
[OpenTelemetry](/resources/lexicon/opentelemetry)-first collection: Works with standard OpenTelemetry collectors, so you keep your existing AWS instrumentation when you move over.
Data in your own storage: Telemetry sits in your own S3 buckets, where the rest of your analytics estate can reach it without another copy being made.
Pricing
Storage and compute run in your own AWS account, so they show up directly on your AWS bill, at your AWS rates. To see what that means for your volumes, talk to an architect, who can model it against your actual traffic.
Best for
Tsuga suits regulated or security-conscious teams that need AWS telemetry to stay inside their own account and IAM boundary. If your estate is small, entirely on AWS and well served by CloudWatch's native dashboards, a separate platform may be more than you need today.
Datadog
Datadog is a SaaS observability platform that brings AWS monitoring into one place. It collects AWS metrics through a native CloudWatch integration and combines them with logs, traces and host-level metrics from the Datadog Agent.
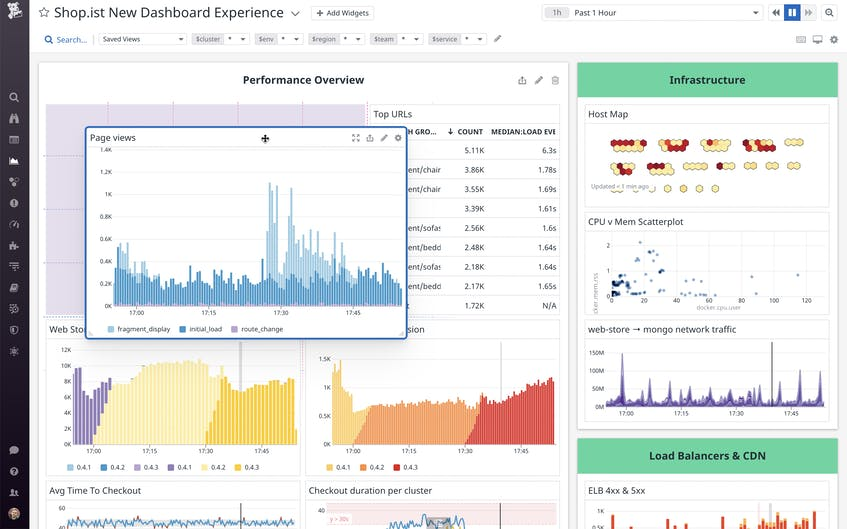
That gives you both a broad view of infrastructure health and a service-level view of application performance. Datadog also covers services outside AWS, so if you run a hybrid or multicloud environment you can monitor all of it from one platform.
Key features
One-click AWS integration: Uses CloudFormation to set up the IAM role, policy and Lambda forwarder, pulling metrics, logs and tags from more than 100 AWS services within minutes.
AWS Organizations support: Covers multi-account and multi-region environments without configuring each account separately.
Agent-based EC2 monitoring: The Datadog Agent on EC2 hosts adds higher-resolution metrics, including memory and disk latency, beyond CloudWatch's default coverage.
Lambda tracing through X-Ray: Adds serverless application performance monitoring (APM) traces across Lambda and the AWS services it calls.
Tag-based filtering: Limits metric collection to the resources you tag, to manage noise and cost.
Pricing and rating
There is a free tier for a small number of hosts with short retention. Paid plans charge per host per month for infrastructure monitoring and separately per host for APM, with log management billed per GB ingested, so AWS monitoring costs scale with both host count and data volume. On G2 it is rated 4.4 out of 5, from around 726 reviews.
Best for
Datadog suits teams monitoring large, multi-account AWS environments alongside non-AWS or hybrid infrastructure in one platform. It is strongest when you want breadth from one vendor and are comfortable with telemetry stored in the vendor's cloud.
Dynatrace
Dynatrace pairs a CloudWatch-based AWS integration with its OneAgent for deeper visibility where metrics alone fall short. The connection can be set up through CloudFormation, as infrastructure as code.
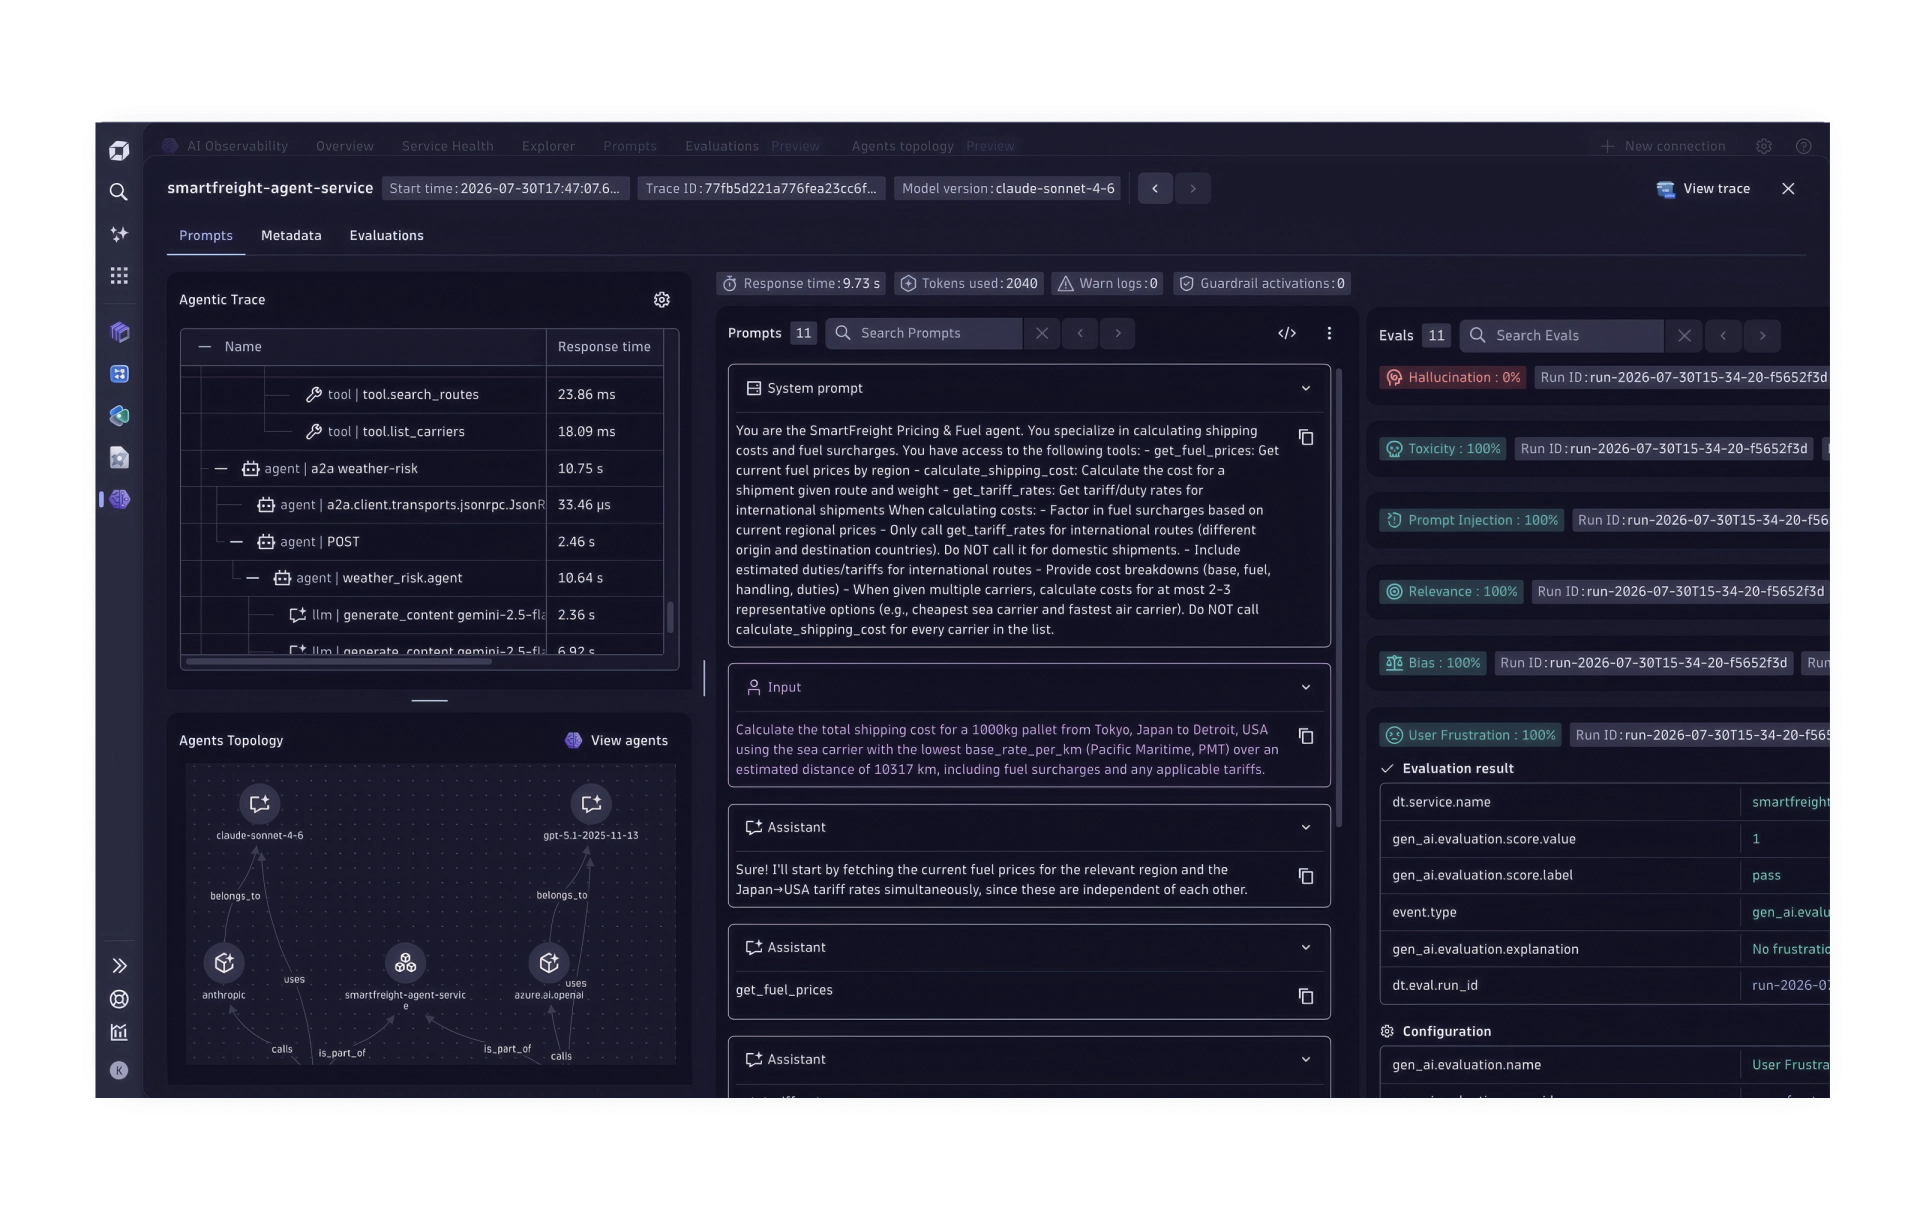
Once connected, Dynatrace discovers resources automatically, builds a topology map with Smartscape, and applies AI-based root cause analysis to the metrics, logs and events it collects. Together they trace an issue back to the AWS resource and dependency chain involved, rather than flagging an isolated metric spike.
Key features
AWS Cloud Platform Monitoring: Ingests CloudWatch metrics, logs, topology and EventBridge events without needing ActiveGate infrastructure.
Smartscape topology mapping: Maps AWS resource dependencies and lets you query relationships, such as idle EC2 instances or unattached EBS volumes, using the Dynatrace Query Language (DQL).
OneAgent auto-instrumentation: Extends CloudWatch coverage with full-stack, code-level visibility across EC2, Lambda and Kubernetes without manual configuration.
AI-based root cause analysis: Identifies business impact and likely root causes across AWS services from the CloudWatch metrics they publish.
Selective service and metric monitoring: Lets you choose which services and metrics each connection monitors, to keep CloudWatch API costs and throttling in check.
Pricing and rating
Full-Stack Monitoring, which covers AWS infrastructure and APM, is priced per host per month according to host memory size, typically on an annual commitment. Logs, traces and Kubernetes are metered separately by consumption. On G2 it is rated 4.5 out of 5, from around 1,366 reviews.
Best for
Dynatrace suits enterprises that need automated root cause analysis across large, complex AWS environments with many accounts and services. Smaller teams with simpler estates may find they are paying for depth they do not yet use.
Grafana Cloud
Grafana Cloud brings CloudWatch data into a fully managed backend, so you do not have to run your own Prometheus exporter. Its Cloud Provider Observability app connects to more than 60 AWS services and uses resource tags to add context to the CloudWatch metrics it collects.
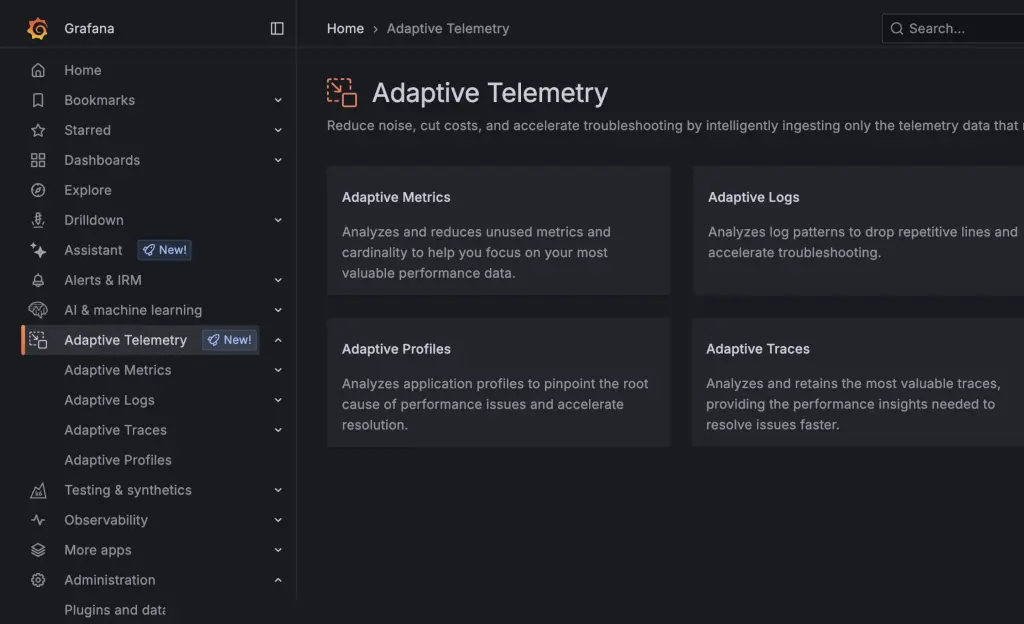
Those metrics can then be queried alongside the rest of your telemetry in Grafana. Because Grafana treats AWS as one data source among many, teams already using it for Kubernetes, on-premises or multicloud monitoring can bring AWS into the same dashboards and alerting rules.
Key features
Cloud Provider Observability app: A managed CloudWatch integration with a single setup portal and no exporter to maintain.
Resource-based tagging: Queries CloudWatch metrics by AWS resource tags, so you can filter and group them without custom scripting.
CloudWatch metric streams: Sends near-real-time metrics through Amazon Data Firehose instead of polling, which reduces lag.
Out-of-the-box AWS dashboards: Prebuilt dashboards for EC2, RDS, Lambda, EBS, CloudFront and AWS costs.
PromQL querying: Lets you explore CloudWatch-sourced metrics in the Prometheus query language rather than a proprietary syntax.
Pricing and rating
A free tier covers a monthly allowance of metric series, logs and traces with short retention. The Pro plan adds a monthly platform fee plus usage, priced separately for metrics, logs, traces and Kubernetes, and Enterprise is sold as an annual contract. On G2 it is rated 4.5 out of 5, from around 190 reviews.
Best for
Grafana Cloud suits teams already standardized on Grafana that want AWS CloudWatch data alongside Kubernetes, on-premises or multicloud monitoring. It rewards teams comfortable writing their own queries and dashboards more than teams looking for opinionated views out of the box.
New Relic
New Relic monitors AWS through agent-based infrastructure monitoring and agentless integrations that call AWS APIs directly. The agentless route covers services such as Lambda, DynamoDB and S3, where a traditional agent cannot be installed.
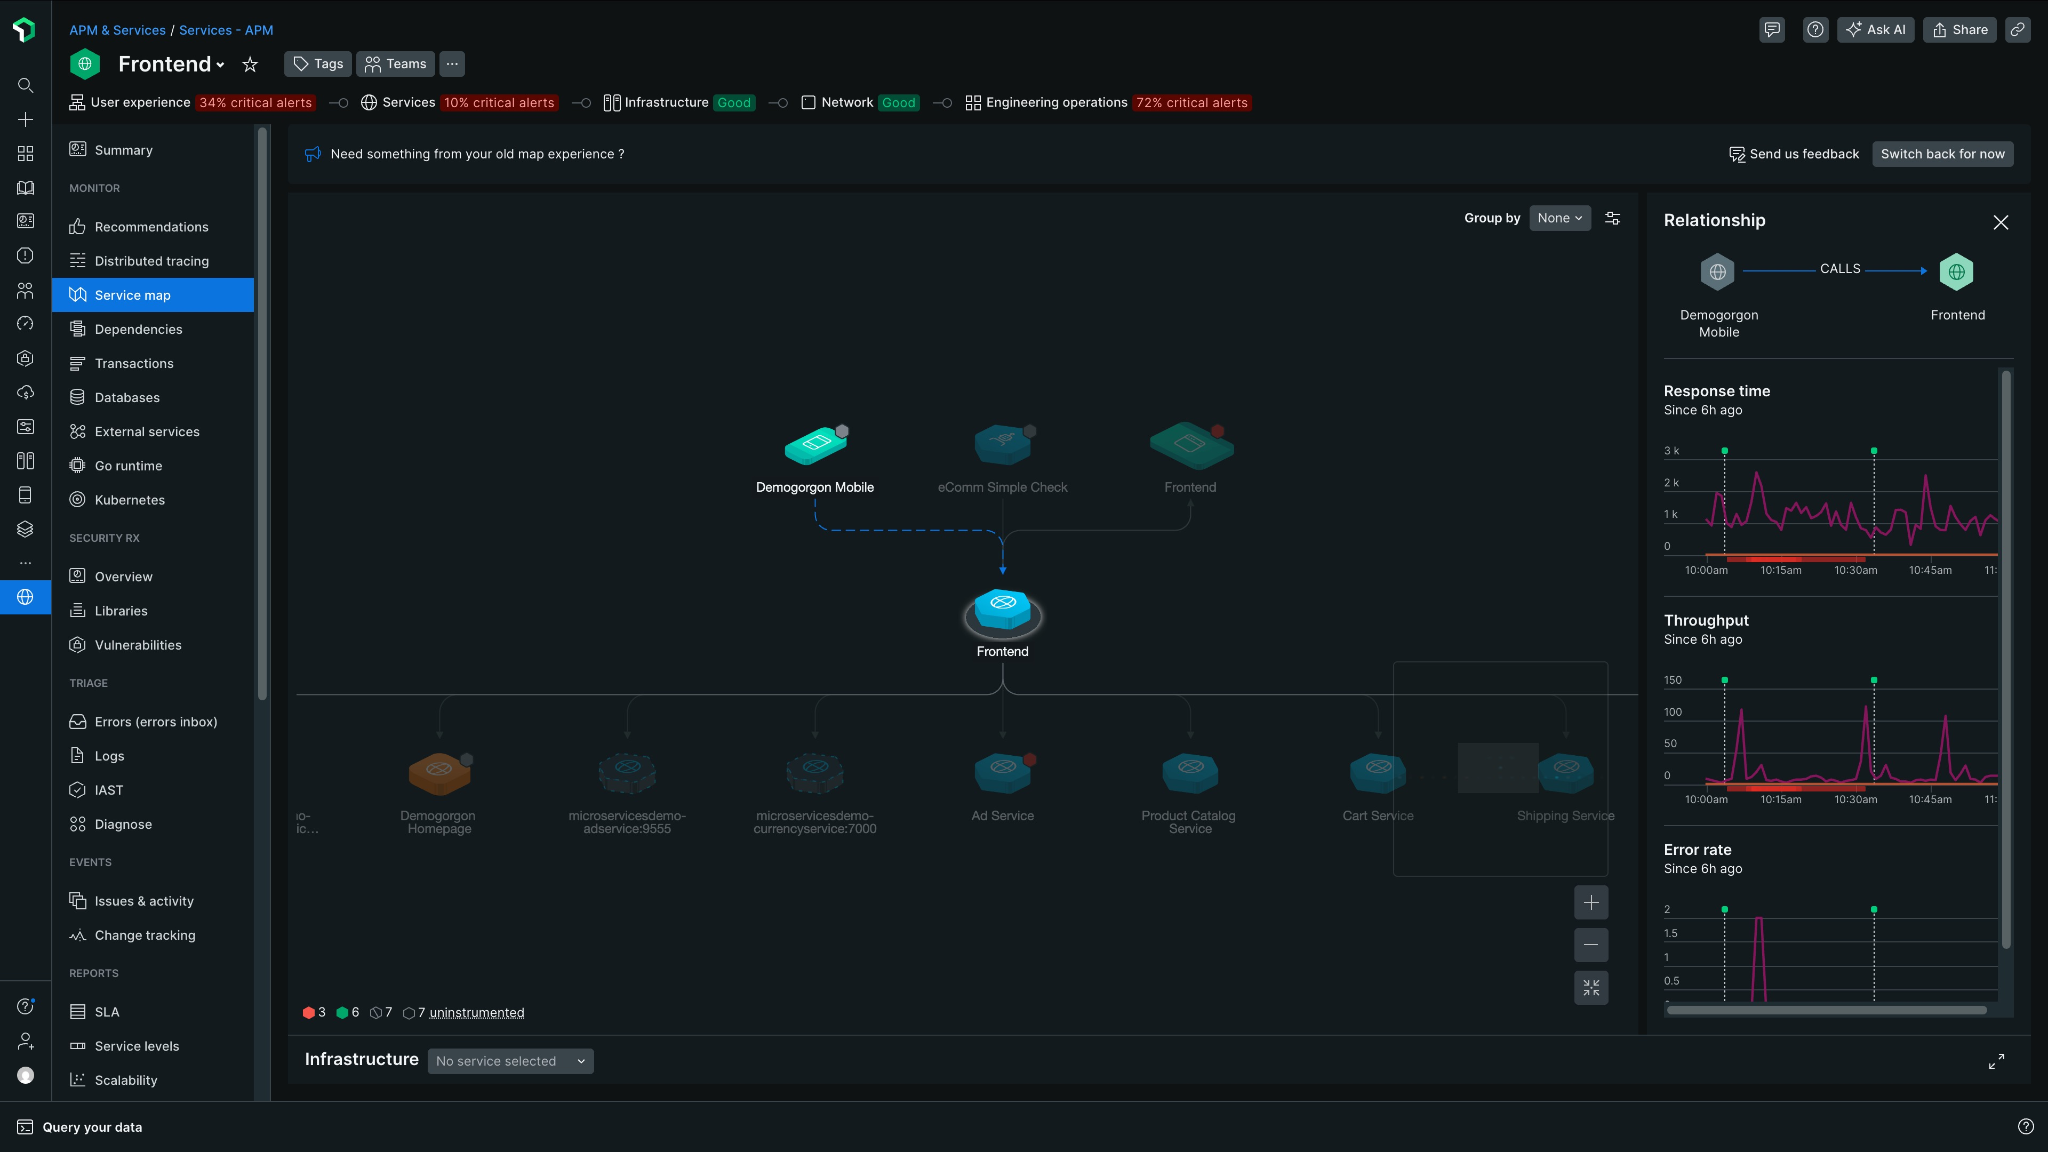
AWS telemetry sits alongside APM data, so infrastructure metrics, traces and application performance live in one platform and an AWS issue is easier to trace to the service or transaction it affects. One-step CloudFormation onboarding also supports multiple AWS accounts and consolidates their telemetry into a single view.
Key features
CloudWatch Metric Streams: Sends near-real-time metrics, including custom namespaces, with less polling latency and throttling.
Agentless cloud integrations: Collects telemetry from supported AWS services through their APIs, with no agent to install.
New Relic Lambda layer: Adds distributed tracing, error analysis and service maps for serverless functions.
Multi-account onboarding: Connects and monitors telemetry across many AWS accounts from a single New Relic setup.
Cost intelligence dashboards: Shows AWS billing and spend by account and region next to performance data.
Pricing and rating
A free tier includes a monthly data ingest allowance and one full platform user. Paid editions bill per GB ingested beyond that allowance plus per user seat, with AWS hosts, containers and Fargate tasks not charged separately. On G2 it is rated 4.4 out of 5, from around 586 reviews.
Best for
New Relic suits teams that want AWS infrastructure, serverless and application performance data correlated within one APM-focused platform. Because seats are part of the bill, it tends to fit best where a known group of engineers does most of the querying.
SigNoz
SigNoz monitors AWS through either a managed integration or a manual OpenTelemetry setup, a choice between a quicker start and more control. The managed option discovers AWS resources and collects metrics and logs without service-by-service configuration.
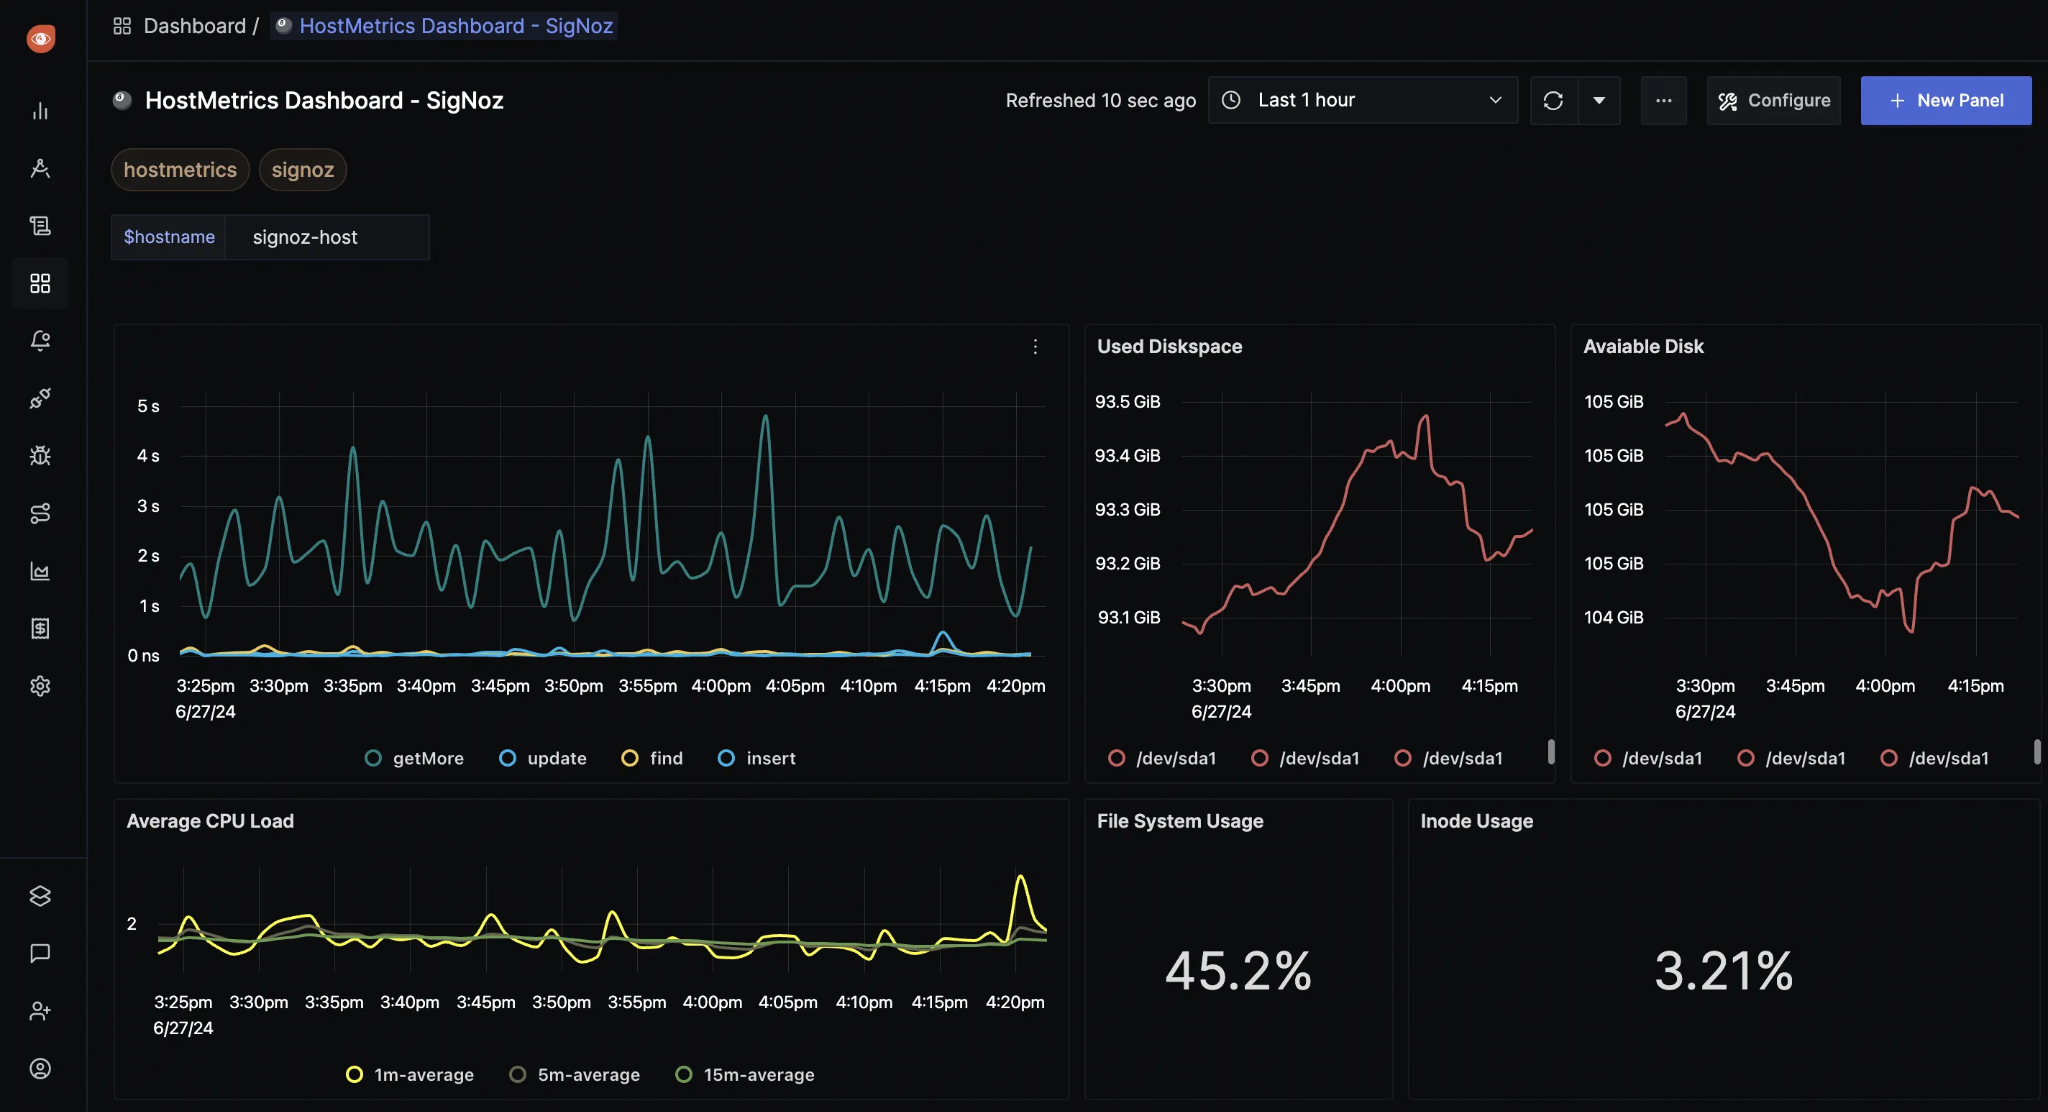
Because SigNoz is built on OpenTelemetry and ClickHouse, AWS telemetry lands in the same open-format backend as data from your other instrumented services. You can work with that data without being tied to a proprietary query layer.
Key features
One-click AWS Integration Agent: Deploys through CloudFormation and automatically monitors newly provisioned resources, including EC2 instances and Lambda functions.
Multi-region and multi-account monitoring: Combines data from several AWS accounts in one SigNoz instance, tagged by account ID.
Prebuilt AWS dashboards: Switches on dashboards automatically for EC2, RDS, Lambda and other connected services.
OpenTelemetry-based manual setup: A self-hosted option that collects AWS metrics and application traces through one OpenTelemetry pipeline.
CloudWatch Metric Streams ingestion: Collects near-real-time metrics through Firehose instead of polling, which reduces data delays.
Pricing
SigNoz Cloud has a monthly base fee that includes an equal amount of usage, with no host-based or user-based pricing. Beyond that, logs and traces are billed per GB ingested and metrics per million samples.
Best for
SigNoz suits teams looking for an open source, OpenTelemetry-native backend for AWS metrics and logs, with the freedom to choose between managed and self-hosted. If you self-host, your team takes on running the ClickHouse backend and its upgrades as well.
Splunk Observability Cloud
Splunk Observability Cloud brings AWS metrics, metadata and logs in from CloudWatch, with two collection options depending on how much control you need, and the standard integration covers supported services out of the box.
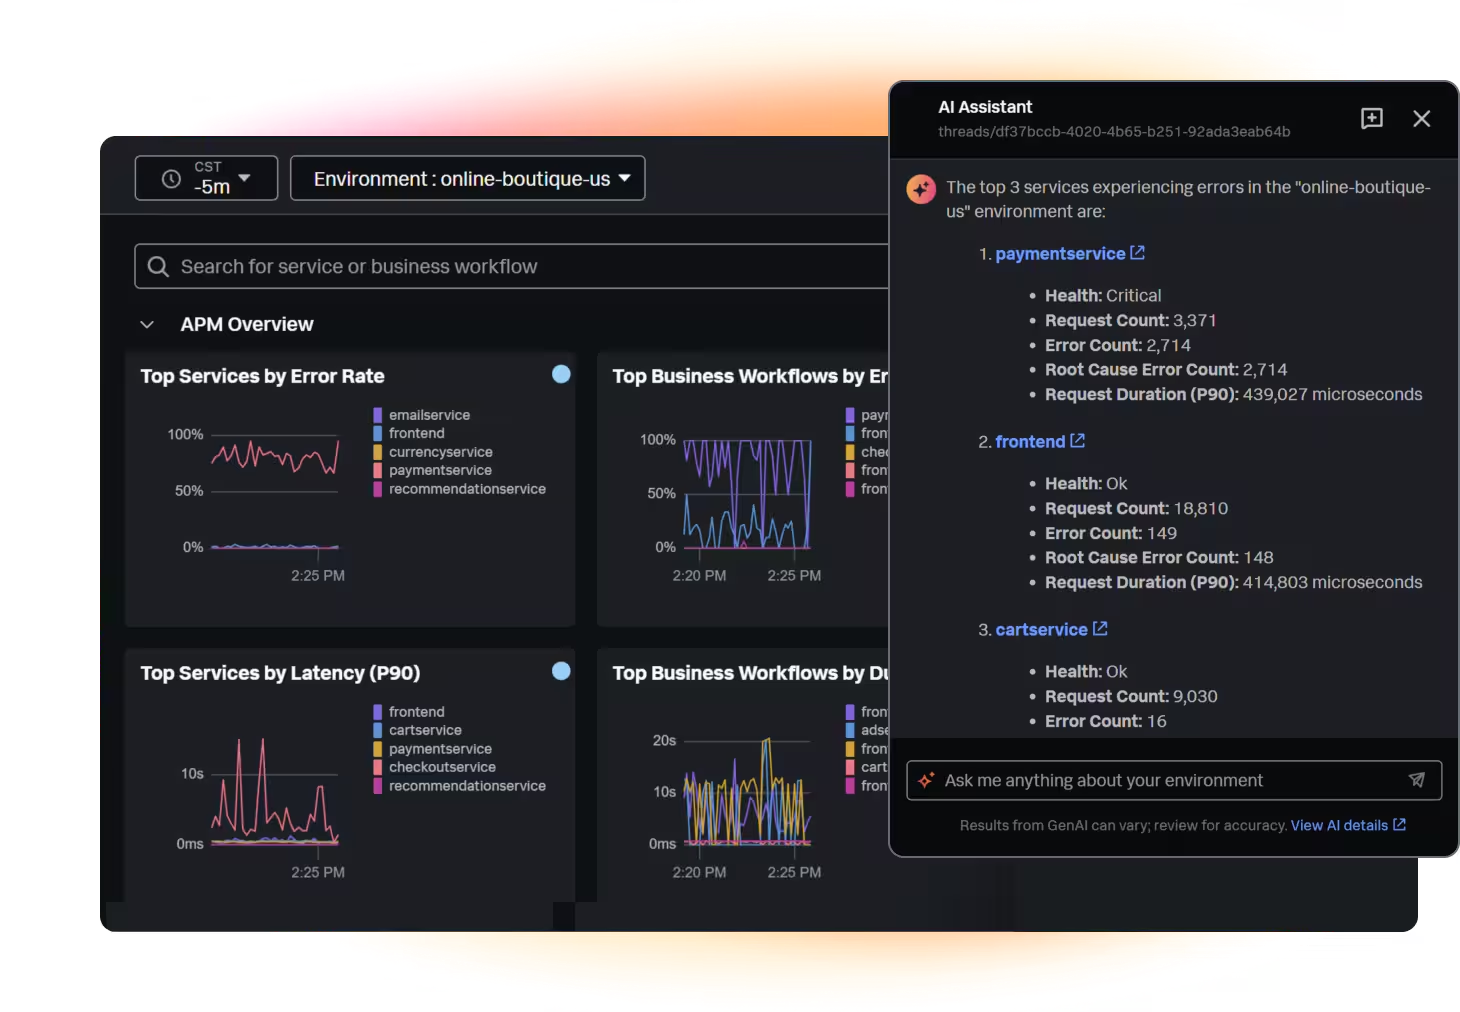
For resources where you manage the underlying instance, such as EC2, the Splunk Distribution of the OpenTelemetry Collector provides finer-resolution metrics. AWS data then appears in the same Infrastructure Overview as your other environments, so hybrid and multicloud teams can monitor AWS without switching tools.
Key features
CloudWatch-based AWS integration: Collects metrics, tags and metadata from supported AWS services by default, with support for custom namespaces and services.
OpenTelemetry Collector option: Covers resources you manage, such as EC2 instances, at finer metric resolution than the standard CloudWatch feed.
Built-in AWS dashboards: Default dashboards organized by AWS service, reachable from Infrastructure Overview or by searching for a service name.
Drill-down navigators: Take you from a service-level metric, such as EC2 fleet health, to a specific instance ID while troubleshooting.
API-based stat selection: Lets you choose which CloudWatch statistics to import instead of the five defaults.
Pricing and rating
There is a free edition. Paid tiers are priced per host per month and billed annually, stepping up from infrastructure monitoring to application and infrastructure, and then to end-to-end coverage. On G2 it is rated 4.3 out of 5, from around 55 reviews.
Best for
Splunk Observability Cloud suits teams running hybrid or multicloud infrastructure that want AWS monitoring folded into a broader observability platform. It fits especially well where Splunk is already the system of record for logs.
Elastic Observability
Elastic Observability is built on the Elasticsearch, Logstash and Kibana (ELK) Stack, so AWS monitoring runs on the same search and analytics engine as Elastic's wider observability and security products. It collects CloudWatch metrics and CloudTrail logs through the Elastic Agent.
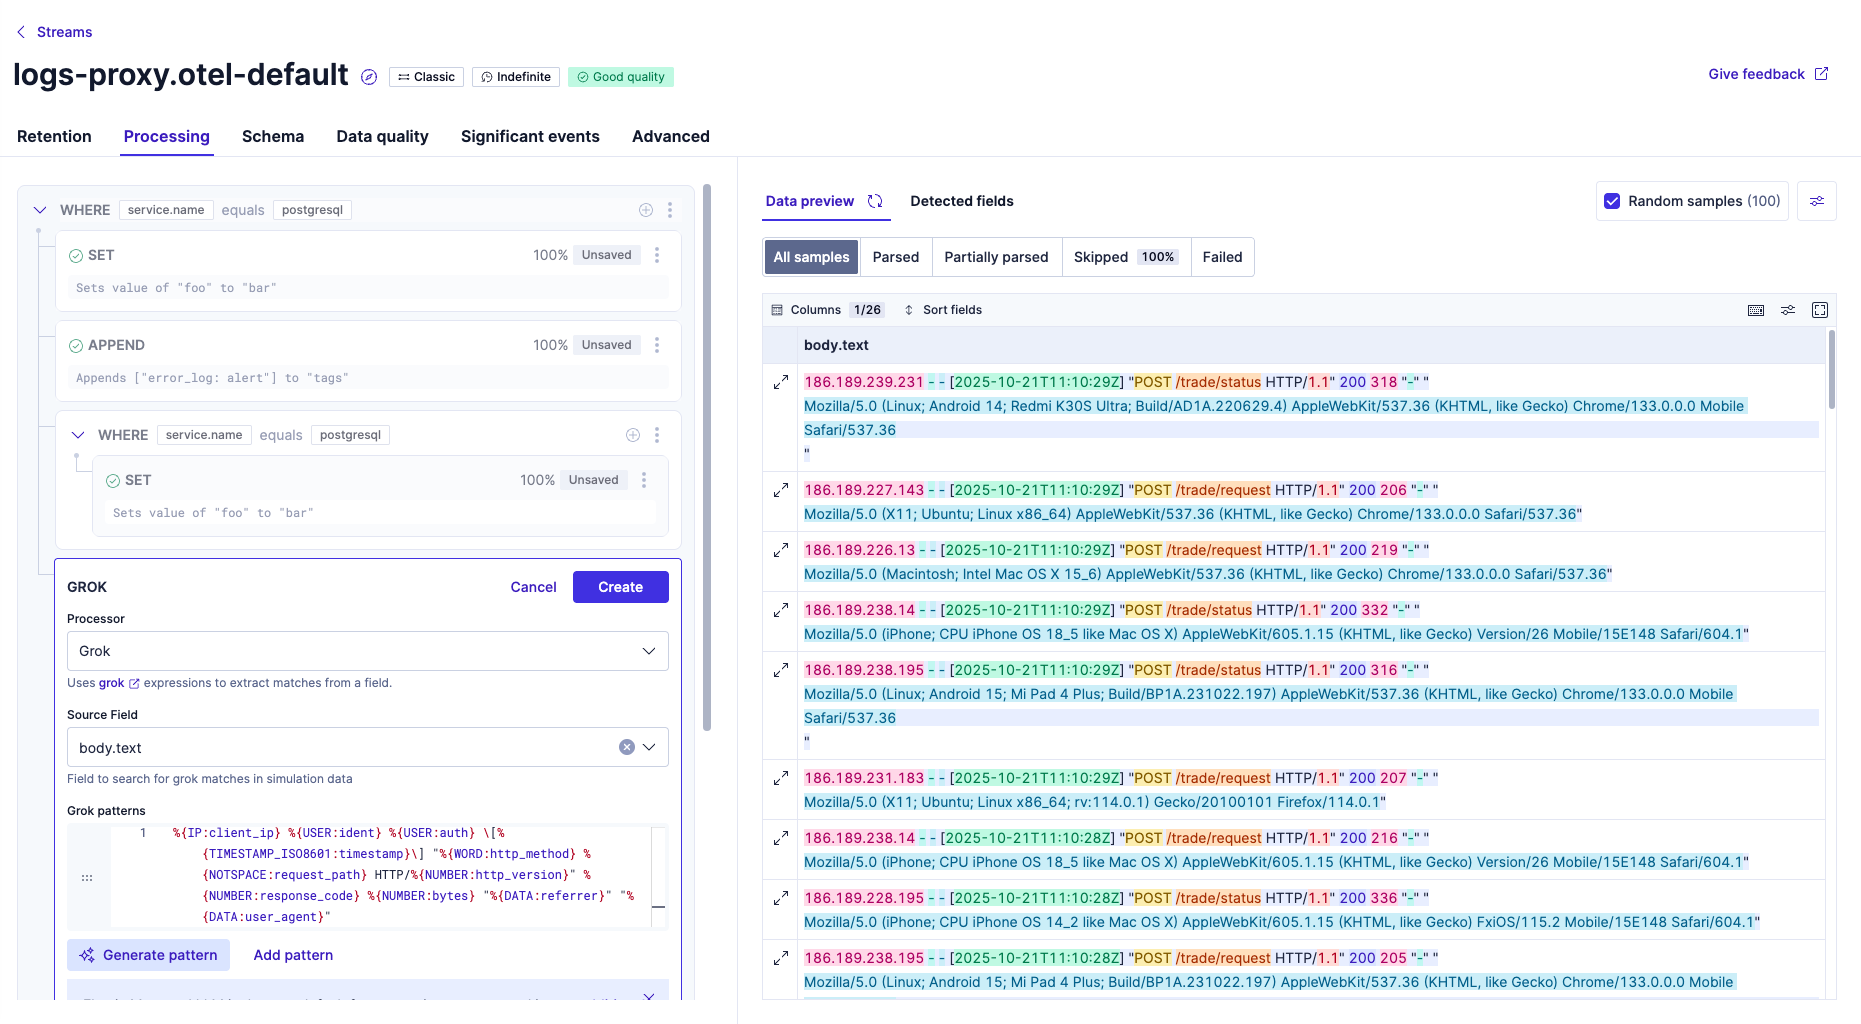
Because Elasticsearch is a general-purpose search engine, you can run ad hoc queries across AWS telemetry like any other indexed data, rather than relying only on predefined dashboards. Elastic supports more than 19 AWS regions, including GovCloud, with deployment options across multiple availability zones.
Key features
More than 200 prebuilt AWS integrations: Cover services such as EC2, Lambda, RDS, S3 and VPC flow logs, each with ready-made Kibana dashboards.
Direct S3 object storage search: Queries data in S3 without rehydrating or reindexing it, which avoids the usual cold-storage tradeoff between performance and cost.
CloudFormation and Terraform integration: Automates deployment and configuration as infrastructure as code, with no manual setup for each account.
Cross-cluster replication: Replicates Elasticsearch clusters across AWS availability zones for high availability of the monitoring data itself.
ML-based root cause correlation: Uses machine learning across AWS metrics, logs and APM traces to surface likely causes.
Pricing and rating
Elastic Observability Serverless is priced per GB ingested and per GB retained each month. The full-stack Complete tier, which covers AWS logs, metrics, traces and synthetics, costs more per GB than the entry tier. On G2 it is rated 4.3 out of 5, from around 104 reviews.
Best for
Elastic Observability suits teams already on the Elastic Stack that want AWS telemetry searchable alongside their existing logs and security data. Self-managed deployments give you the most control, and with it the work of running the clusters.
Better Stack
Better Stack connects to AWS through a CloudFormation stack deployed in your account, and that one integration reaches CloudWatch metrics, log groups, CloudTrail audit logs and X-Ray traces without a separate setup for each.
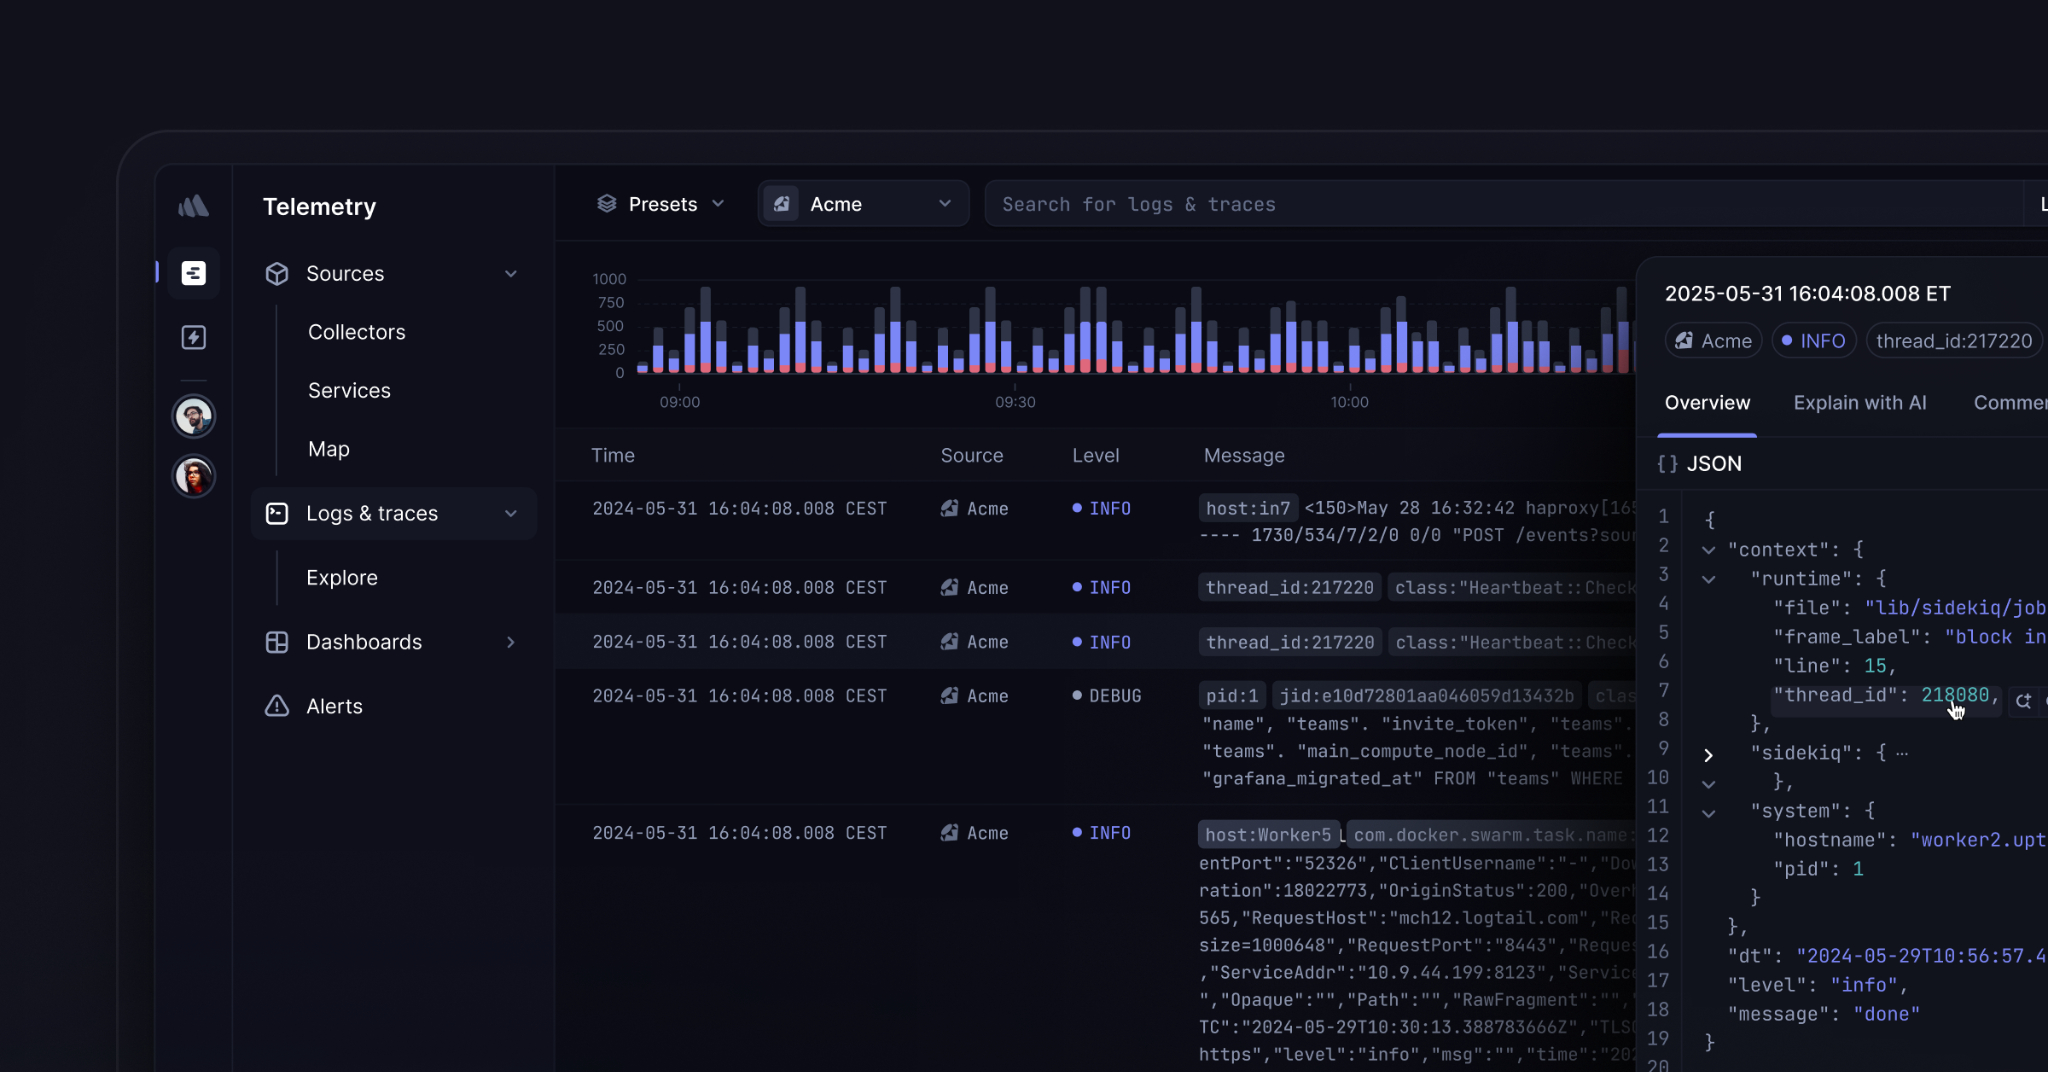
You then choose which metrics and log groups to collect and query, so you do not ingest every namespace by default. Better Stack also connects directly to CloudWatch alarms through Amazon Simple Notification Service (SNS), so your existing AWS alerts feed the same incident and on-call workflows the rest of the platform uses.
Key features
Single CloudFormation deployment: Configures CloudWatch metrics, logs, CloudTrail and X-Ray through one stack.
Selective metric and log ingestion: Collects all metrics, specific namespaces or individual log groups.
Near-real-time metric streaming: Uses CloudWatch Metric Streams and Data Firehose, with an option to switch streaming off to reduce costs.
CloudWatch alarm forwarding through SNS: Sends existing alarm states into Better Stack's on-call and incident workflows.
Native AWS service coverage: Supports ECS, EKS, Elastic Load Balancing, Fargate and Lambda.
Pricing and rating
A free tier covers a set number of uptime monitors plus small log, trace and metric allowances. Paid plans are billed annually, with logs and traces charged per GB ingested plus per GB retained, and bundled tiers are available that combine a fixed volume across logs, traces and metrics. On G2 it is rated 4.8 out of 5, from around 343 reviews.
Best for
Better Stack suits teams that want AWS alerting and on-call brought together with uptime monitoring, while keeping their existing CloudWatch alarms. Its center of gravity is incident response, so teams after deep APM or topology analysis may want to pair it with something else.
Related terms
- AWS CloudWatchAmazon CloudWatch is AWS's built in monitoring service: metrics, logs, alarms, and dashboards, with tracing through X-Ray, integrated by default with nearly every AWS service.
- AWS monitoring built for cost control and data residencyAWS monitoring is the practice of collecting and reading metrics, logs, and traces from the AWS services your applications run on, from EC2 instances and containers through to managed databases and serverless functions, so you can tell whether the platform and the applications on it are healthy.
- BYOCBYOC, Bring Your Own Cloud, is a deployment model where a vendor's software runs inside the customer's own cloud account, operated by the vendor but living on infrastructure the customer owns.
- DatadogDatadog is the largest SaaS observability platform, spanning infrastructure monitoring, APM, logs, RUM, security, and dozens of adjacent products, collected largely through its proprietary agent and priced per product.
- DynatraceDynatrace is an enterprise observability platform known for its OneAgent automatic instrumentation, the Davis AI engine for root cause analysis, and the Grail data lakehouse, sold on a consumption based pricing model.
- Elastic ObservabilityElastic offers observability built on the Elasticsearch stack: log search at its core, with metrics, traces, and APM layered on, available self managed or as the hosted Elastic Cloud.
- GrafanaGrafana is the open source standard for dashboards, and Grafana Labs builds an observability stack around it: Loki for logs, Tempo for traces, Mimir for metrics, with Grafana Cloud as the managed offering.
- Here are 11 reliable Azure monitoring tools for your cloud stackWe compared eleven Azure monitoring tools: Azure Monitor, Tsuga, Datadog, Dynatrace, New Relic, Grafana Cloud, Elastic Observability, Splunk Observability Cloud, LogicMonitor, Better Stack and Site24x7.
- New RelicNew Relic is one of the original APM vendors, now a broad all in one observability SaaS covering APM, infrastructure, logs, browser monitoring, and more, priced on data ingested plus per user seats.
- SplunkSplunk is the long standing leader in log analytics and SIEM, acquired by Cisco in 2024, offering log search through its SPL query language plus an observability suite spanning metrics and traces.