Lexicon · Guide
Here are 11 reliable Azure monitoring tools for your cloud stack
Eleven Azure monitoring tools compared by how each connects to Azure, what it monitors and how it charges, so you can see which one fits your team and your data.
Quick summary
We compared eleven Azure monitoring tools: Azure Monitor, Tsuga, Datadog, Dynatrace, New Relic, Grafana Cloud, Elastic Observability, Splunk Observability Cloud, LogicMonitor, Better Stack and Site24x7. Each suits a different Azure monitoring need, and Tsuga is the one built for teams whose telemetry has to stay inside their own Azure subscription, through a bring your own cloud (BYOC) deployment. Here is a quick glance at each platform.
List of 11 leading Azure monitoring tools
Azure Monitor
Azure Monitor is Microsoft's native monitoring platform, built into the Azure control plane rather than deployed as a separate product. It sits at the center of the Azure observability stack, bringing infrastructure, platform and application telemetry together in one system.
Application data flows through Application Insights, while infrastructure data comes through VM Insights and Container Insights. Log Analytics workspaces provide a shared query layer for analyzing this telemetry across a subscription.
Key features
Kusto Query Language (KQL): A purpose-built query language for searching and correlating log and trace data across Log Analytics workspaces at scale.
Application Insights: OpenTelemetry-based application performance monitoring (APM) for request rates, dependency calls and failure rates in live Azure applications.
Azure Monitor Agent (AMA): A unified agent that uses Data Collection Rules to collect telemetry from virtual machines (VMs) and other resources, replacing older service-specific agents.
Dynamic thresholds and smart detection: Machine learning-based alerting that adapts to metric patterns and automatically flags application anomalies.
Native resource integration: Collects activity logs and diagnostics from Azure resources automatically, with no separate agent to deploy.
Pricing
Pricing is mainly based on log ingestion and retention by the gigabyte.
Analytics Logs queries are free, while Basic and Auxiliary log queries and long-term retention are charged, standard platform metrics are free, advanced and Prometheus metrics are priced per sample, and alerts are charged by rules and signals.
Best for
Azure Monitor suits teams standardizing on Azure that want built-in monitoring without deploying or managing a separate platform.
Tsuga
We deploy the Tsuga engine directly inside your Azure subscription, so telemetry does not have to leave your environment. It runs inside your own virtual network, and logs, metrics and traces land in your own Azure Blob storage.
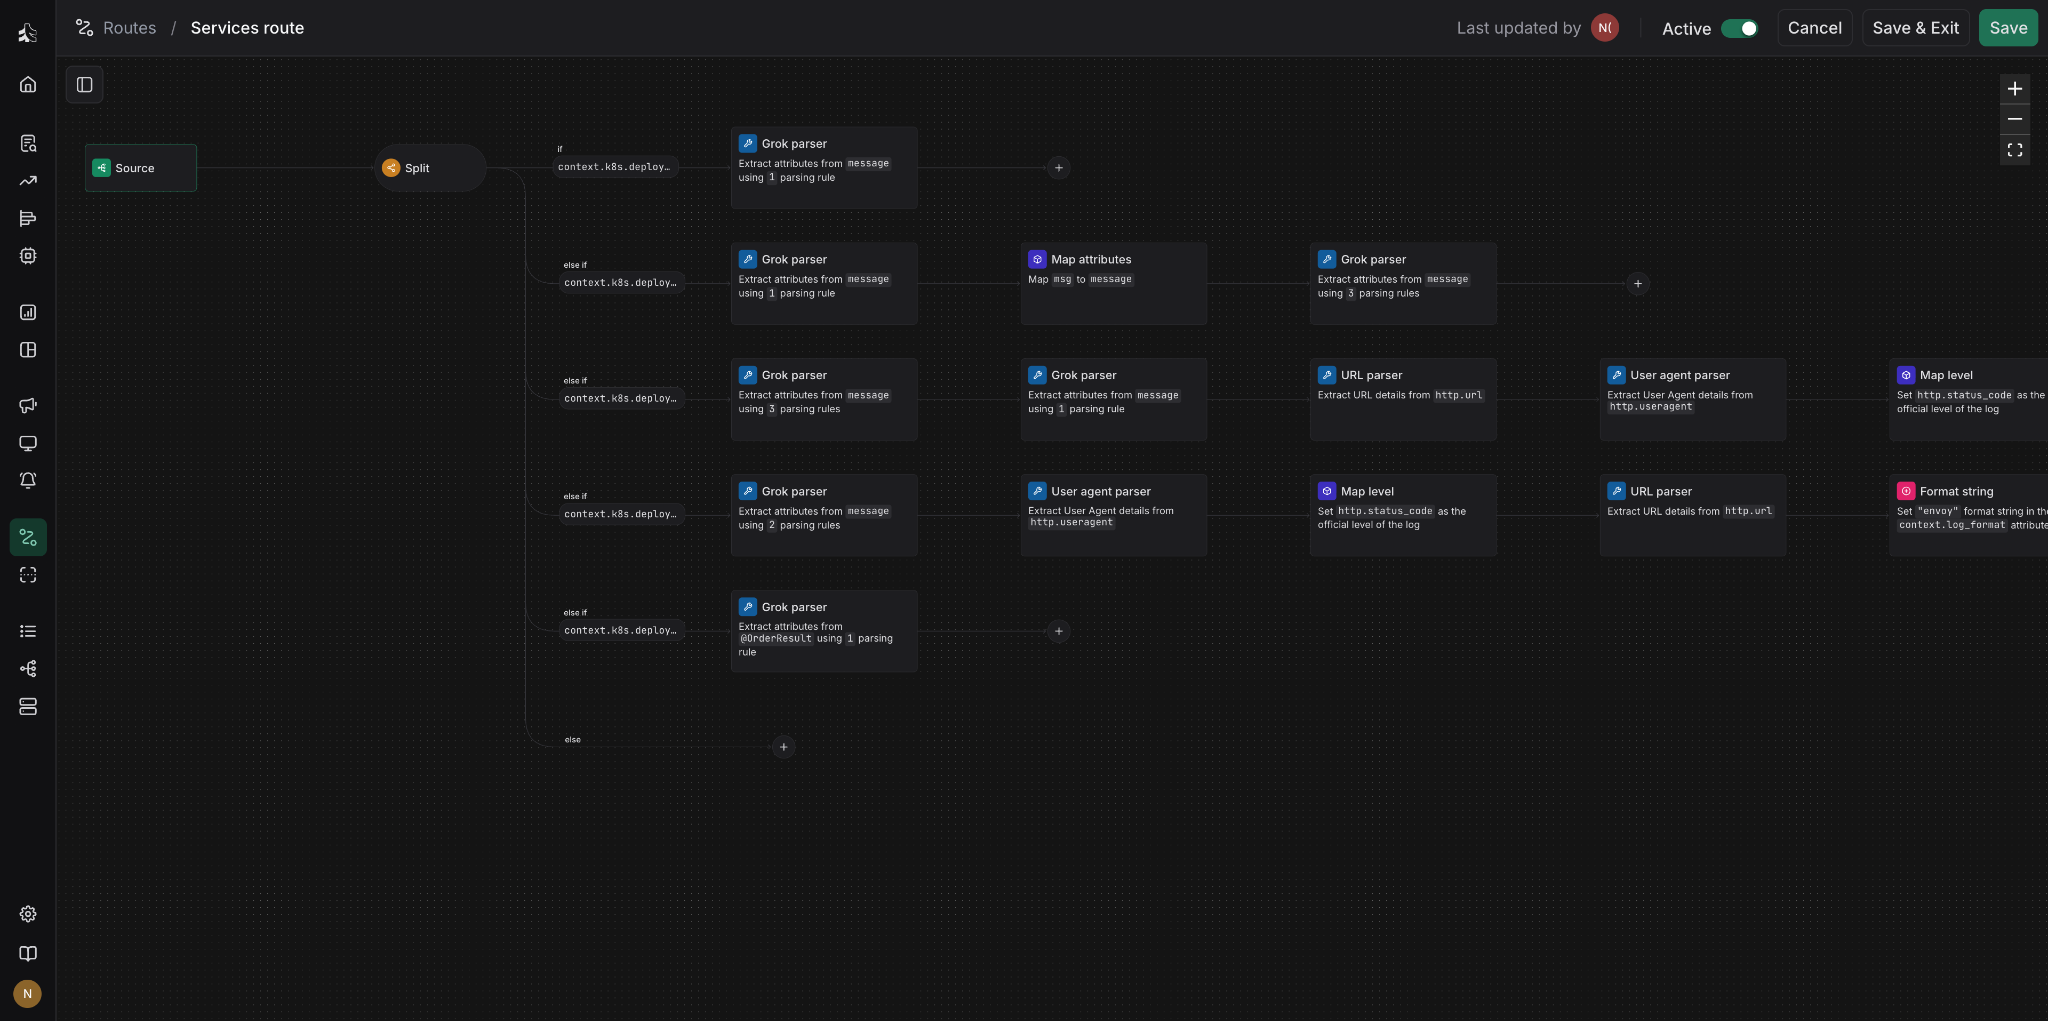
We manage the platform remotely through a control plane connected over mutual TLS, while the data plane, storage, indexing and processing stay inside your Azure tenant. Managed by Tsuga. Owned by you.
Key features
Runs in your Azure subscription: The engine installs through infrastructure as code and runs inside your own virtual network, with nothing about the deployment requiring telemetry to leave the subscription that produced it.
[In-tenant data residency](/solutions/sovereign-observability): Telemetry stays inside your Azure environment, encrypted with keys you control.
Inline WASM filters: Transform and validate telemetry at the edge before it reaches storage.
[Open ingestion standards](/solutions/open-observability): Built on OpenTelemetry and open data formats, so your Azure telemetry is not locked into a proprietary format.
Pricing
Storage and compute run in your own Azure subscription, so they show up directly on your Azure bill, at your Azure rates.
To see what that means for your volumes, talk to an architect, who can model it against your actual traffic.
Best for
Tsuga suits regulated or high-volume Azure teams that need to keep more of their telemetry without sending it outside their tenant.
Datadog
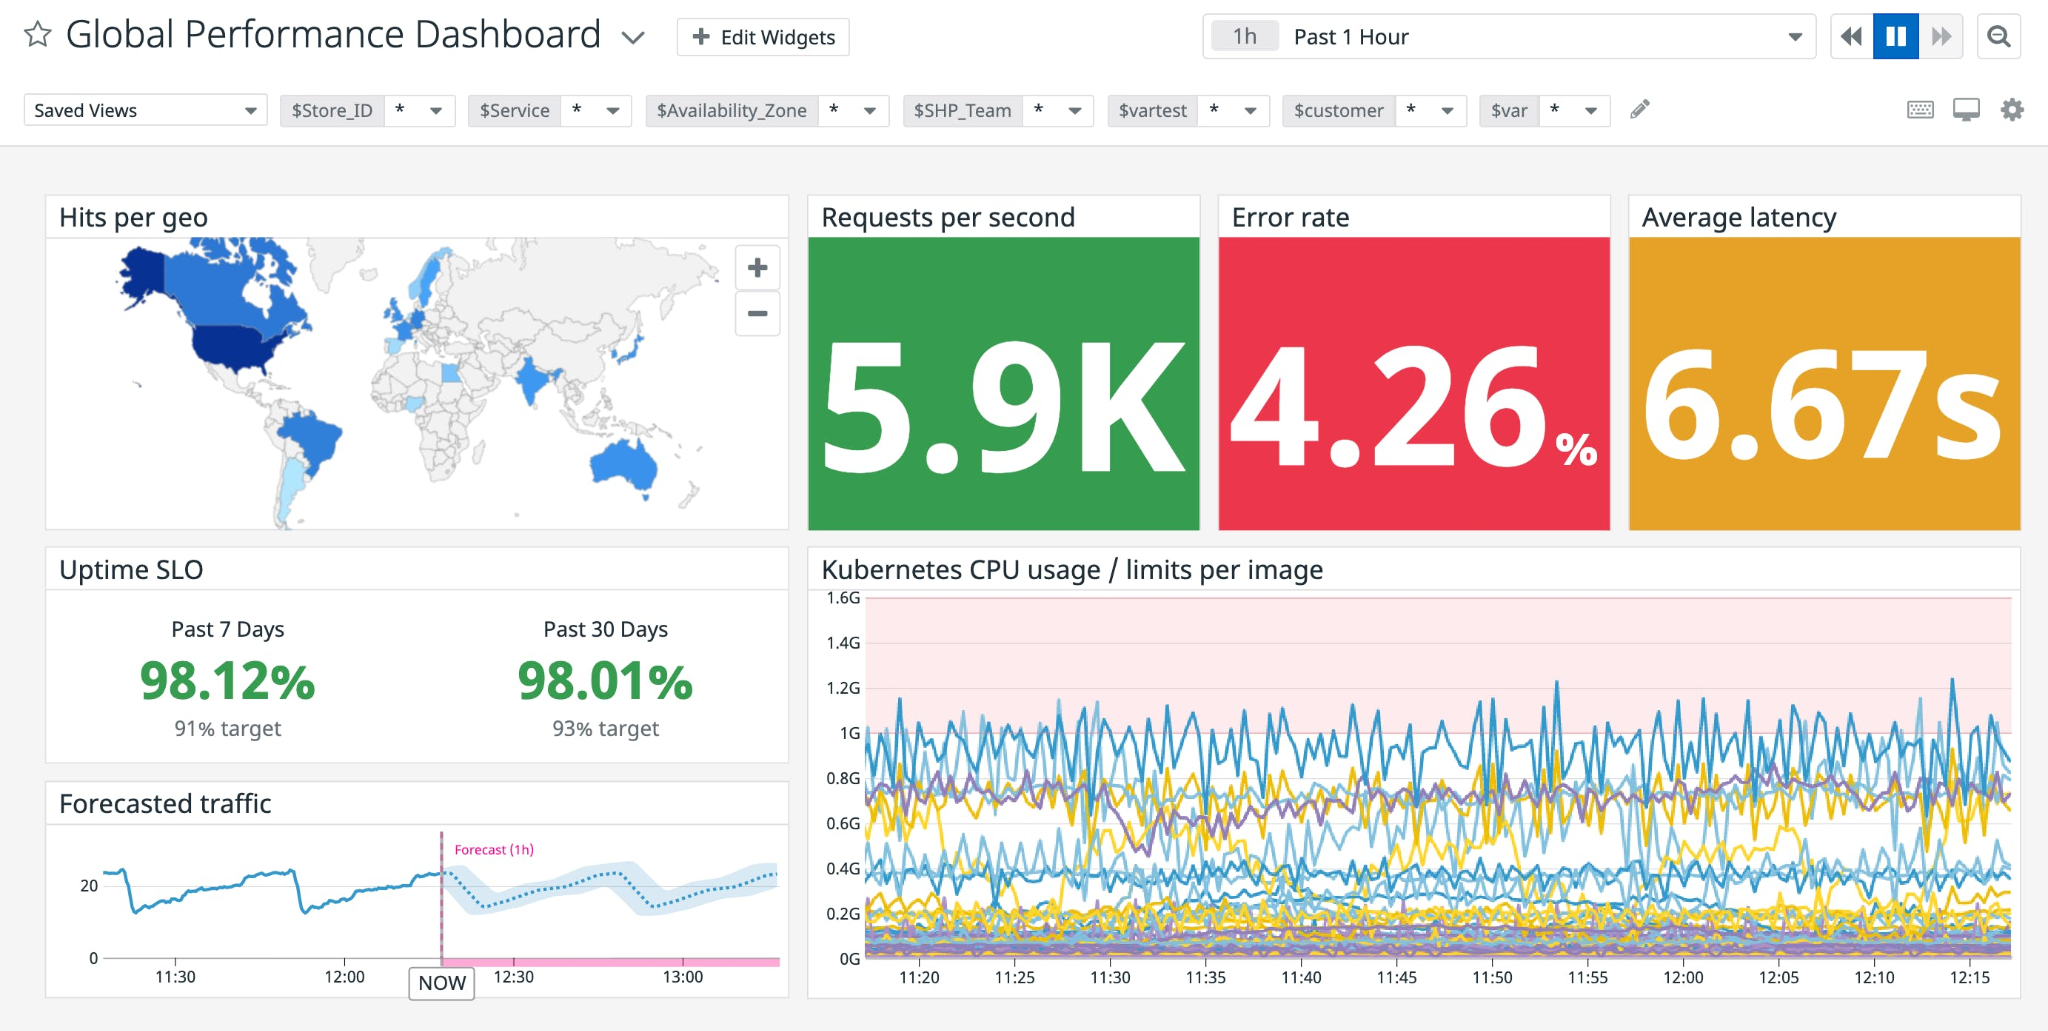
Datadog runs as an Azure Native independent software vendor (ISV) Service, so you can provision and manage it like other Azure resources through the Azure Portal, CLI or software development kits (SDKs). Its Azure integration continuously collects metrics, logs and tags from Azure services, bringing infrastructure, application and log data into one platform. It supports more than 60 Azure services, including Azure Kubernetes Service (AKS), App Services, Cosmos DB and SQL Server, and automatic discovery extends coverage as new subscriptions are added.
Key features
Multi-subscription monitoring: A single Datadog resource can monitor every subscription in an Azure tenant, without setting up integrations one by one.
Azure Monitor metric ingestion: Collects metrics and dimensional tags from Azure Monitor-supported services, making them available as filterable tags in Datadog.
Application Insights custom metrics: Imports custom Application Insights metrics with a one-click setting, which can help teams moving away from native Azure monitoring.
Cloud Security Posture Management (CSPM): Can be enabled from the Azure resource blade to scan Azure configurations for security misconfigurations.
Log collection templates: Automate log forwarding from Azure resources, so you do not have to build pipelines by hand.
Pricing
There is a free tier for a small number of hosts with short retention.
Paid plans charge per host per month for infrastructure monitoring and separately per host for APM, with log management billed per GB ingested, so Azure monitoring costs scale with both host count and data volume.
Best for
Datadog suits teams moving from or adding to Azure Monitor that want Azure telemetry together with non-Azure infrastructure in one platform.
Dynatrace
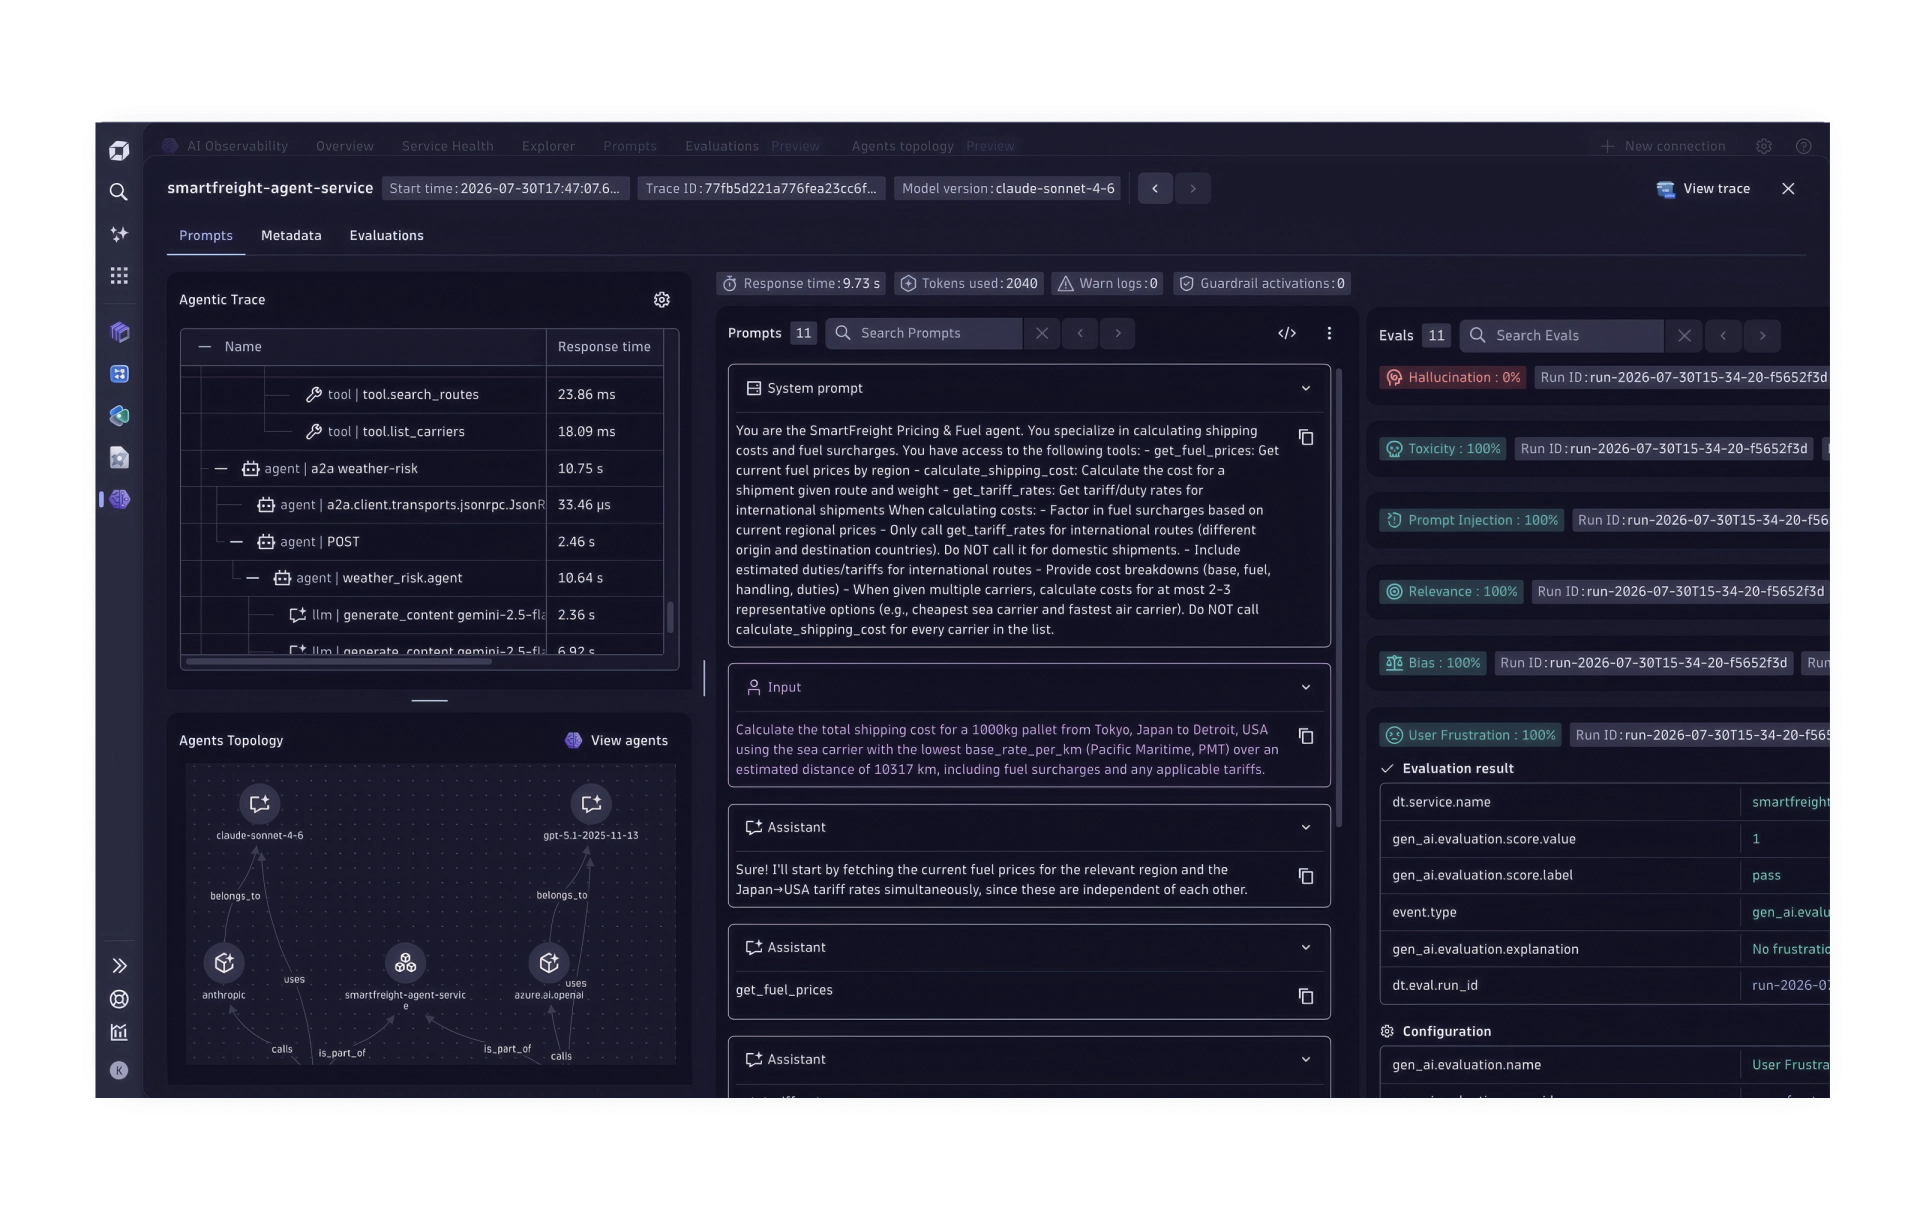
Dynatrace monitors Azure through two main paths. OneAgent runs directly on resources such as VMs, AKS and App Service to provide code-level visibility, while a remote Azure Monitor integration covers services OneAgent cannot instrument, including serverless workloads, and the Azure Native Dynatrace Service can be provisioned and billed as an Azure resource. Once activated, out-of-the-box dashboards and topology maps cover core Azure services, and you can choose which service metrics to collect.
Key features
OneAgent instrumentation: Deploys and configures itself on Azure compute resources, providing code-level tracing without manual agent management.
Azure Native Dynatrace Service: Provisioned and billed as an Azure resource, with logs and metrics forwarded automatically after activation.
One-click Azure Monitor activation: Enables Azure Monitor log and metric collection directly from the Azure Portal without separate infrastructure setup.
Azure Lighthouse support: Provides multi-tenant access, so one Dynatrace integration can monitor resources across several customer tenants.
Grail-based querying: Stores Azure telemetry in Dynatrace's Grail data lakehouse, where it can be queried with the Dynatrace Query Language (DQL) alongside logs, metrics and traces from other environments.
Pricing
Full-Stack Monitoring, which covers infrastructure and APM, is priced per host per month according to host memory size, with logs, traces and Kubernetes metered separately by consumption.
Best for
Dynatrace suits organizations running hybrid or multicloud Azure estates that need unified billing and cross-environment root cause analysis.
New Relic
New Relic collects Azure telemetry through its Azure Monitor integration, polling supported Azure services at set intervals and storing the results as dimensional metrics you can query with the New Relic Query Language (NRQL).
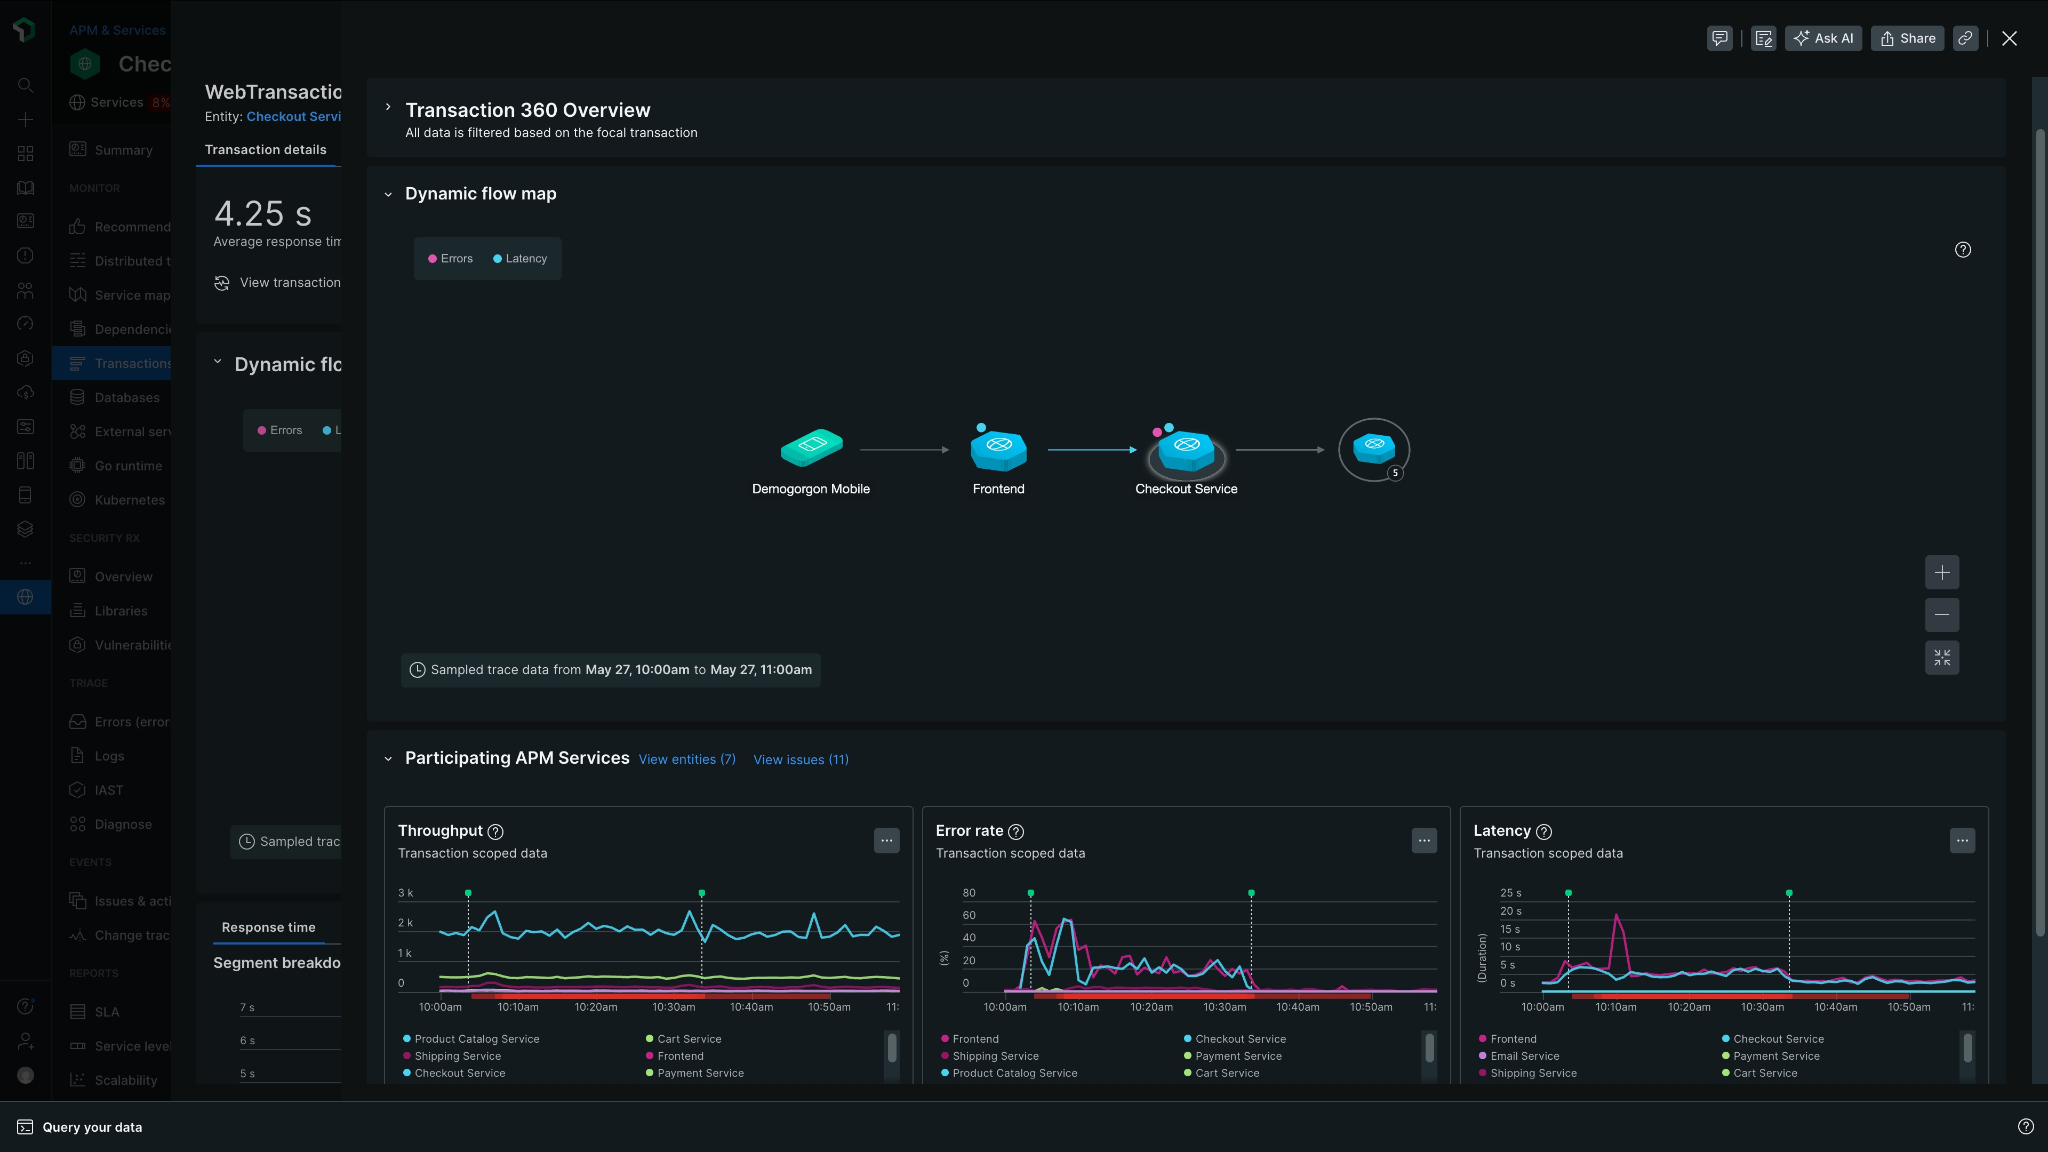
Because it uses the Azure Monitor API rather than separate service-specific calls, it can cover any service Azure Monitor supports, with new metrics added as Azure introduces them. You can also deploy New Relic as an Azure Native Service through the Azure Marketplace, with management handled through Azure's resource provider.
Key features
Azure Monitor integration: Queries Azure Monitor-supported services at a configurable polling interval, with no separate API calls for each service.
Resource and tag filtering: Limits data collection to specific resource types, resource groups or tags.
Azure Native New Relic Service: Provisioned and managed as an Azure resource through the Marketplace, with billing consolidated into your Azure contract.
Application Insights ingestion: Collects Application Insights telemetry through the same Azure Monitor integration and makes it available in prebuilt dashboards.
NRQL querying: Makes Azure metrics available as dimensional data alongside APM, logs and infrastructure data from other sources.
Pricing
New Relic has a free tier with a monthly data allowance and one full platform user.
Paid editions bill on data ingested beyond the free allowance plus user seats, with Azure hosts, containers and serverless functions included at no extra cost.
Best for
New Relic suits teams that want Azure telemetry together with application and infrastructure data from a broader, multi-source stack.
Grafana Cloud
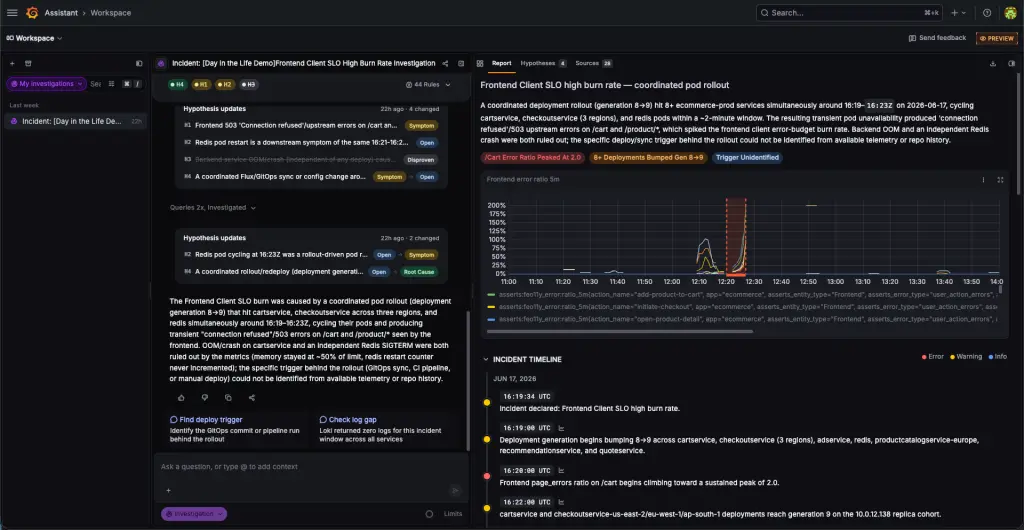
Grafana Cloud connects to Azure through serverless streaming from Azure Monitor and Event Hub, or through Grafana Alloy, its OpenTelemetry Collector distribution, for a fully managed pipeline. Both bring Azure metrics and logs into the same backend used for other cloud providers, so you can view Azure alongside AWS, Google Cloud and on-premises data without separate silos. The Azure Observability app also provides preconfigured dashboards for services such as API gateways and AKS, which saves building these views by hand.
Key features
Serverless log and metric streaming: Streams data in real time from Azure Monitor and Event Hub, with no collector infrastructure to deploy.
Grafana Alloy pipelines: A managed OpenTelemetry Collector distribution with native Prometheus pipelines, for teams that prefer an agent-based approach.
Azure Observability app: Preconfigured dashboards for API gateways, AKS and virtual machines.
Metric selection and aggregation: Lets you choose which Azure metrics to ingest, which helps manage signal noise and ingestion costs.
Cross-cloud data unification: Stores Azure metrics and logs alongside data from other cloud providers, so you can query them together.
Pricing
A free tier covers a limited number of metric series and a monthly allowance of logs and traces, with short retention.
Pro plans add a monthly platform fee plus usage priced separately for metrics, logs, traces and Kubernetes, and Enterprise is an annual contract.
Best for
Grafana Cloud suits multicloud teams that want Azure metrics and logs unified with other providers on an open-source-based backend.
Elastic Observability
Elastic Observability collects Azure telemetry through Elastic Agent, pulling activity logs, resource logs and metrics through the Azure REST API and Azure Monitor. That covers compute resources such as VMs and Kubernetes as well as services such as Azure SQL Database.
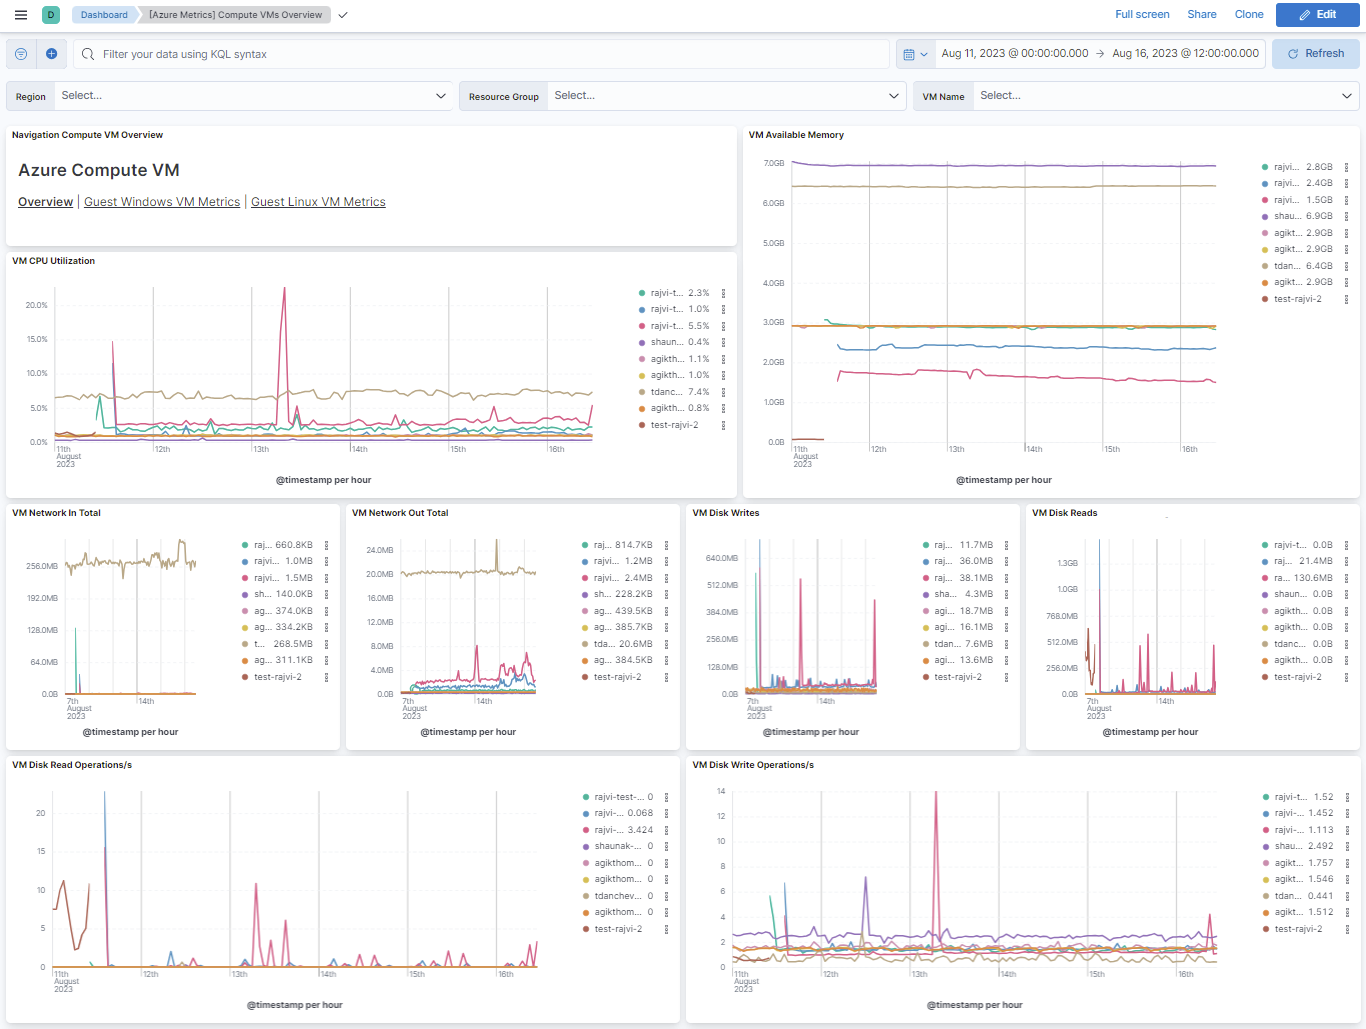
Elastic Cloud is also available as a first-party service in the Azure console, so you can provision and bill deployments like other Azure resources. Once collected, Azure data sits alongside logs, metrics and APM traces from the rest of a hybrid environment in a single Elasticsearch-backed stack, with Kibana as the query interface.
Key features
Native Azure console integration: Elastic Cloud deployments can be discovered, provisioned and billed directly through the Azure console.
Tag-based filtering: Limits data collection to specific resources using Azure tags.
Event Hub log export: Sends Azure subscription and resource logs to Event Hub, where Elastic Agent collects them for broader audit visibility.
Machine learning anomaly detection: Identifies performance issues and correlates likely root causes across Azure metrics.
Automatic APM instrumentation: Captures application traces from .NET, Java, Python and other languages running on Azure compute without manual instrumentation.
Pricing
Elastic Observability Serverless prices on data ingested and data retained per GB, with a higher rate for the full-stack Complete tier that covers Azure logs, metrics, traces and synthetics.
Best for
Elastic suits teams running hybrid Azure and on-premises environments that want logs, metrics and traces unified in one Elastic stack.
Splunk Observability Cloud
Splunk Observability Cloud connects to Azure through a guided setup using Azure app credentials, then imports metrics and metadata from the subscriptions you select. It collects data from a defined set of supported Azure services by default, and unsupported resource types can be added manually as custom services through the UI or API.
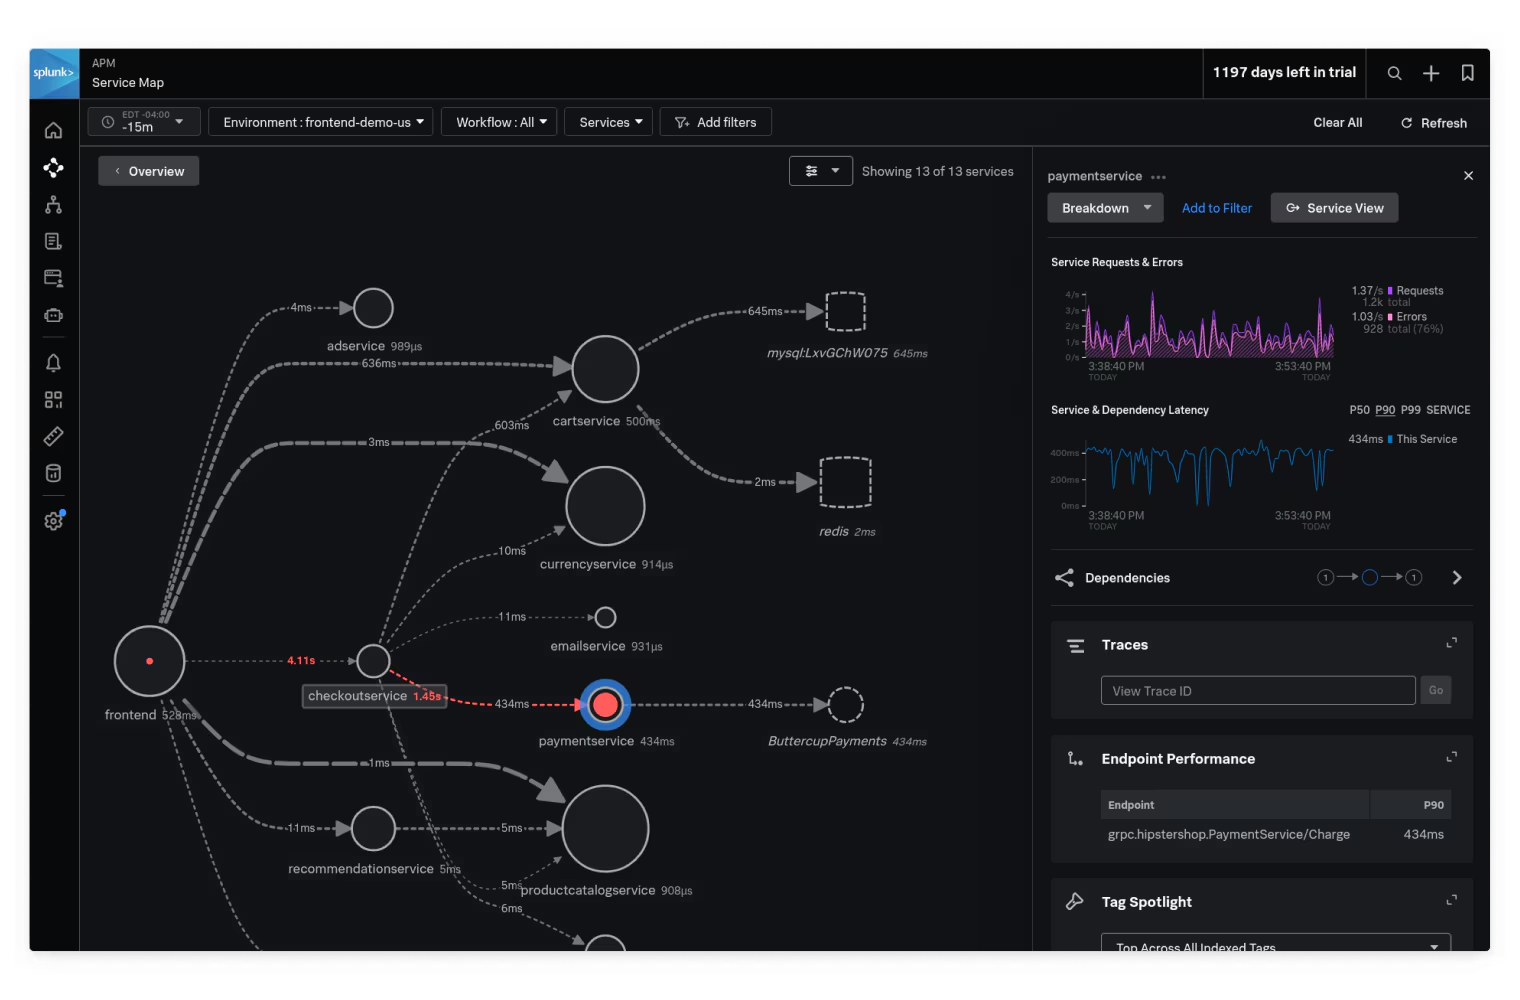
Once connected, Azure metrics carry an azure_resource_id dimension and appear in the same navigators and dashboards Splunk uses for other infrastructure, which gives you a consistent view across hybrid and multicloud environments.
Key features
Guided Azure connection setup: Uses Directory ID, App ID and client secret credentials, then lets you choose which subscriptions and services to monitor.
Custom service support: Lets you add unsupported Azure resource types manually as custom services.
Automatic metadata normalization: Converts Azure metric dimensions and tags to lowercase to account for inconsistent casing in Azure Monitor.
Tag and dimension filtering: Filters Azure monitoring data by region, hostname or custom tags, with unsupported characters sanitized automatically.
Built-in Azure navigators and dashboards: Prebuilt views of Azure service health, so you do not have to create dashboards from scratch.
Pricing
Splunk Observability Cloud has a free edition.
Paid tiers are priced per host per month for infrastructure monitoring, for app and infrastructure, and for end-to-end coverage, all billed annually.
Best for
Splunk suits teams that want Azure infrastructure metrics normalized and unified with existing hybrid or multicloud Splunk monitoring.
LogicMonitor
LogicMonitor connects to Azure through the LM Cloud setup wizard, which authenticates against a subscription and discovers resources automatically, with no tags or scripts needed beforehand. It covers more than 60 Azure services, including VMs, App Services, Functions, Cosmos DB and AKS.
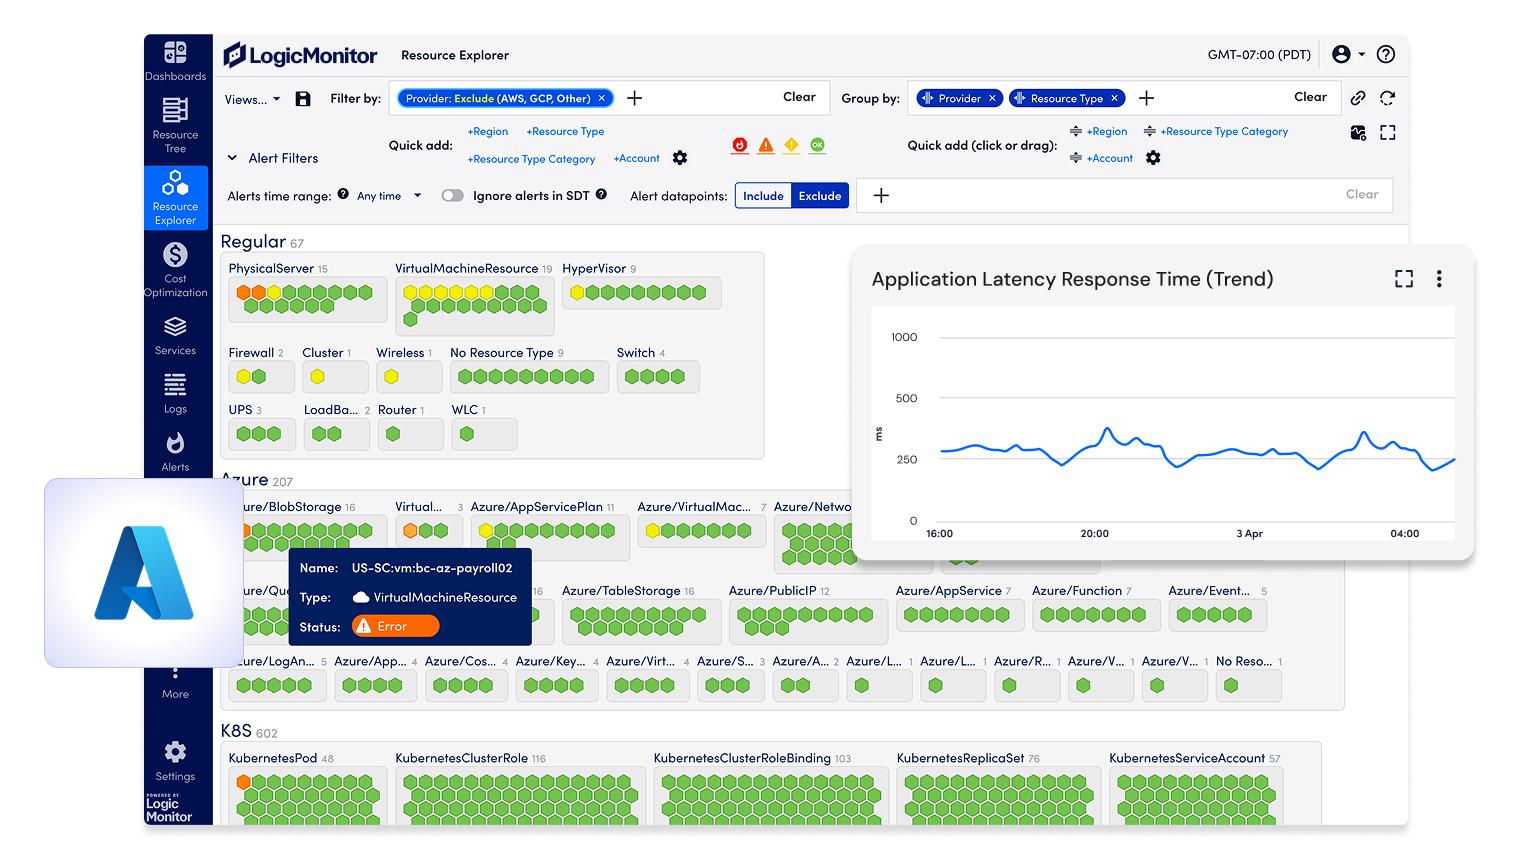
Data is collected through Azure Monitor APIs, with an optional collector for OS-level and application metrics those APIs do not expose. Once connected, Azure resources appear alongside AWS, Google Cloud and on-premises infrastructure in the same dashboards, topology maps and alerting.
Key features
Auto-discovery setup wizard: Connects to an Azure subscription and detects resources automatically, without manual tagging or scripting.
Multi-subscription and tenant support: A single LM Envision connection can span several subscriptions and tenants, giving one view across the Azure environment.
Optional collector for deeper metrics: A lightweight collector adds OS-level and application metrics for Azure VMs that Azure Monitor APIs do not provide on their own.
AI-driven baseline anomaly detection: Learns normal usage patterns for each resource and flags unusual behavior, which helps reduce false-positive alerts.
Azure cost dashboards: Built-in billing views break down Azure spending by tag, region and utilization without separate tools.
Pricing
LogicMonitor prices by Hybrid Unit.
Each Azure infrastructure resource counts as one unit, several platform resources together count as one, and a free trial is available.
Best for
LogicMonitor suits hybrid and multicloud teams that want Azure resources discovered automatically and correlated with AWS, Google Cloud and on-premises infrastructure.
Better Stack
Better Stack connects with Azure through a webhook integration between Azure Monitor and its incident management platform. Azure Action Groups can forward metric, log search and activity log alerts directly to Better Stack as incidents.
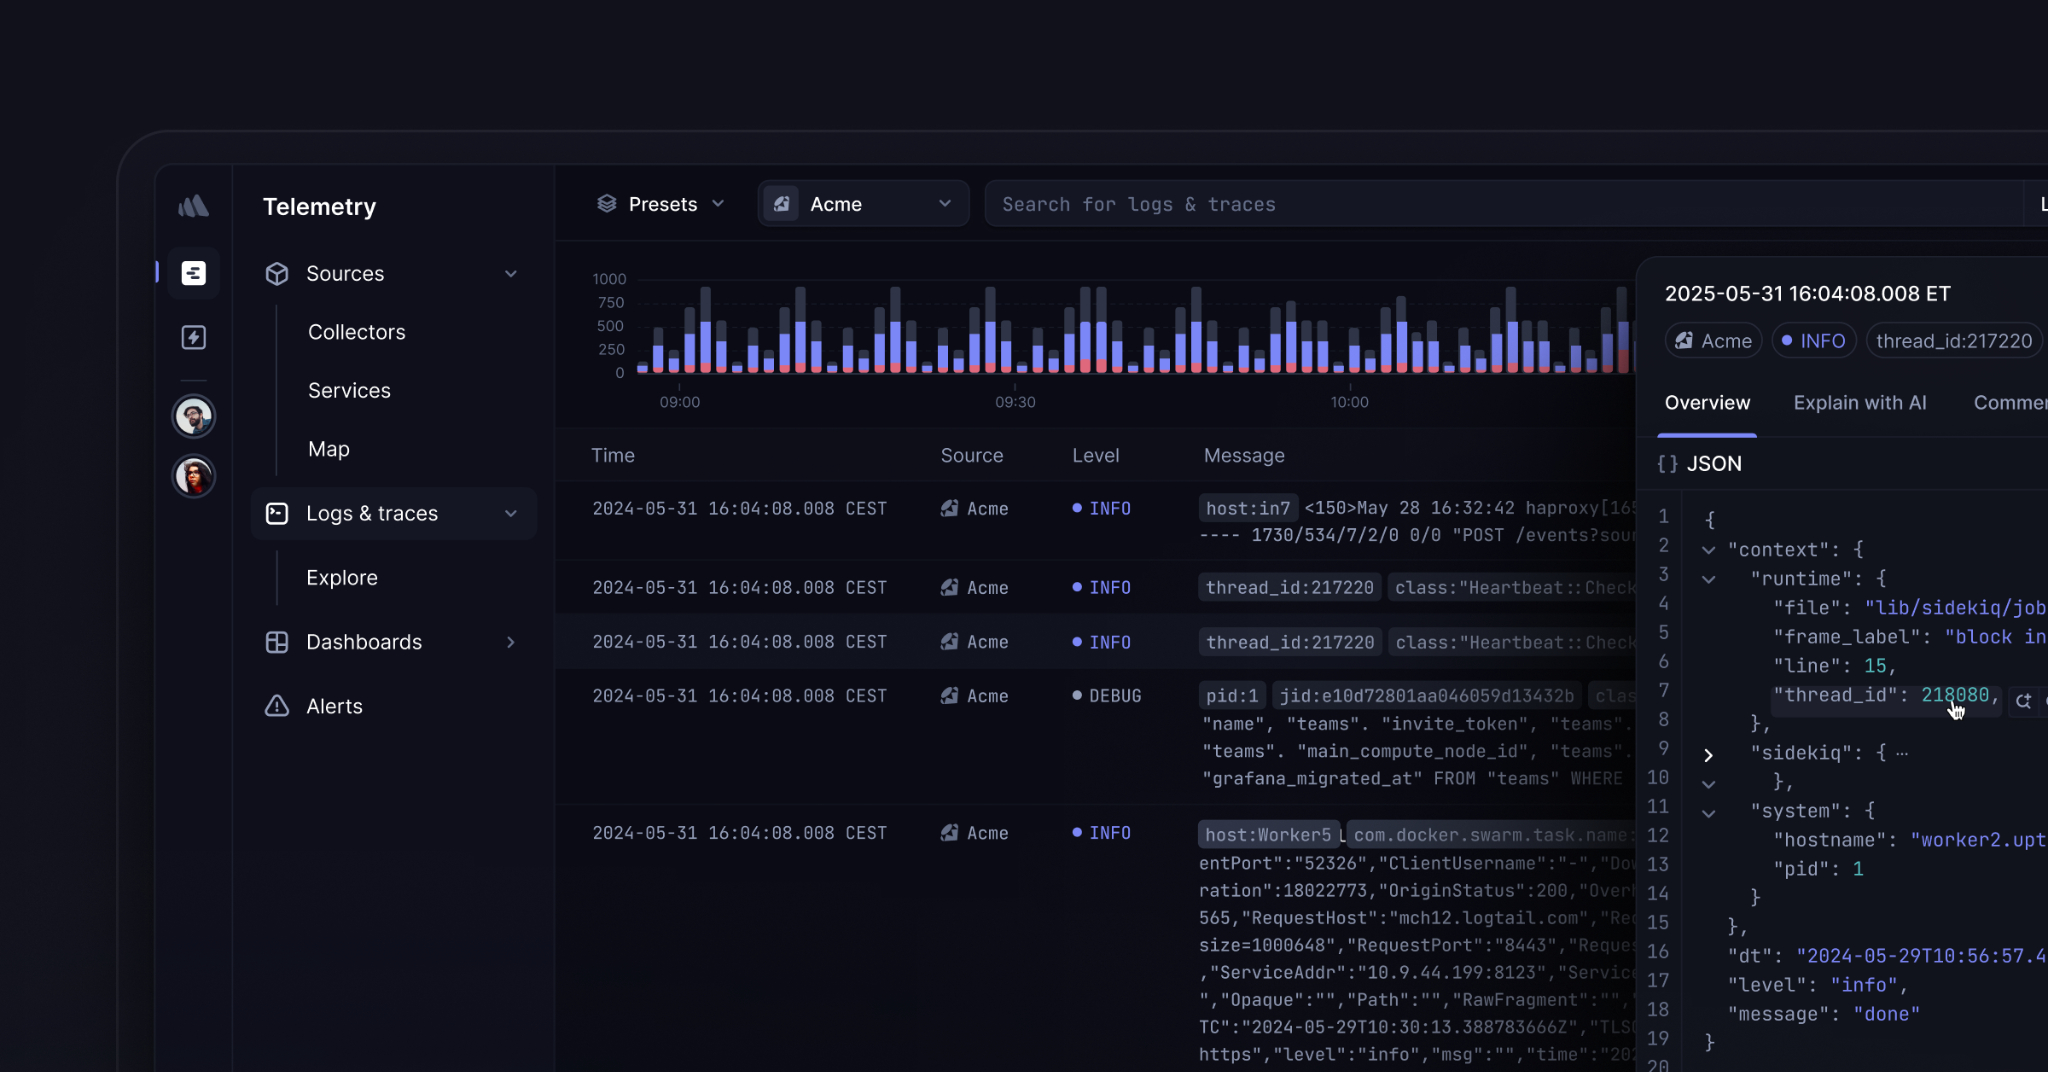
Separately, its telemetry platform collects logs, traces and metrics through OpenTelemetry, so Azure resources instrumented with standard OpenTelemetry collectors appear in the same dashboards as other infrastructure. Together, the two integrations let Azure Monitor handle alert conditions while Better Stack provides the on-call layer.
Key features
Azure Monitor alert integration: Azure Action Groups send metric, log search and activity log alerts to Better Stack as incidents through webhooks.
Escalation policies and on-call scheduling: Routes Azure-generated incidents through configurable escalation chains instead of relying on Azure's native notification actions.
OpenTelemetry-based telemetry ingestion: Collects logs, traces and metrics from Azure-hosted services through standard OpenTelemetry collectors, alongside non-Azure sources.
Unified incident view: Shows Azure-originated incidents alongside uptime, infrastructure and other integrations in the same timeline.
API-managed integrations: Lets you create, list and update Azure integrations programmatically across several Azure environments.
Pricing
A free tier covers a set number of monitors plus small log, trace and metric allowances.
Paid plans are billed annually, with logs and traces charged per GB ingested plus per GB retained, and bundled tiers combine a fixed volume across logs, traces and metrics.
Best for
Better Stack suits teams that want Azure Monitor alerts routed through proper on-call escalation rather than relying on Azure's native notifications.
Site24x7
Site24x7 connects to Azure through zero-touch auto-discovery, pulling in resources such as VMs, AKS and Cosmos DB through the Azure Monitor REST API once a subscription is added. It covers more than 100 Azure services across infrastructure as a service (IaaS) and platform as a service (PaaS), including compute, storage, databases and networking.
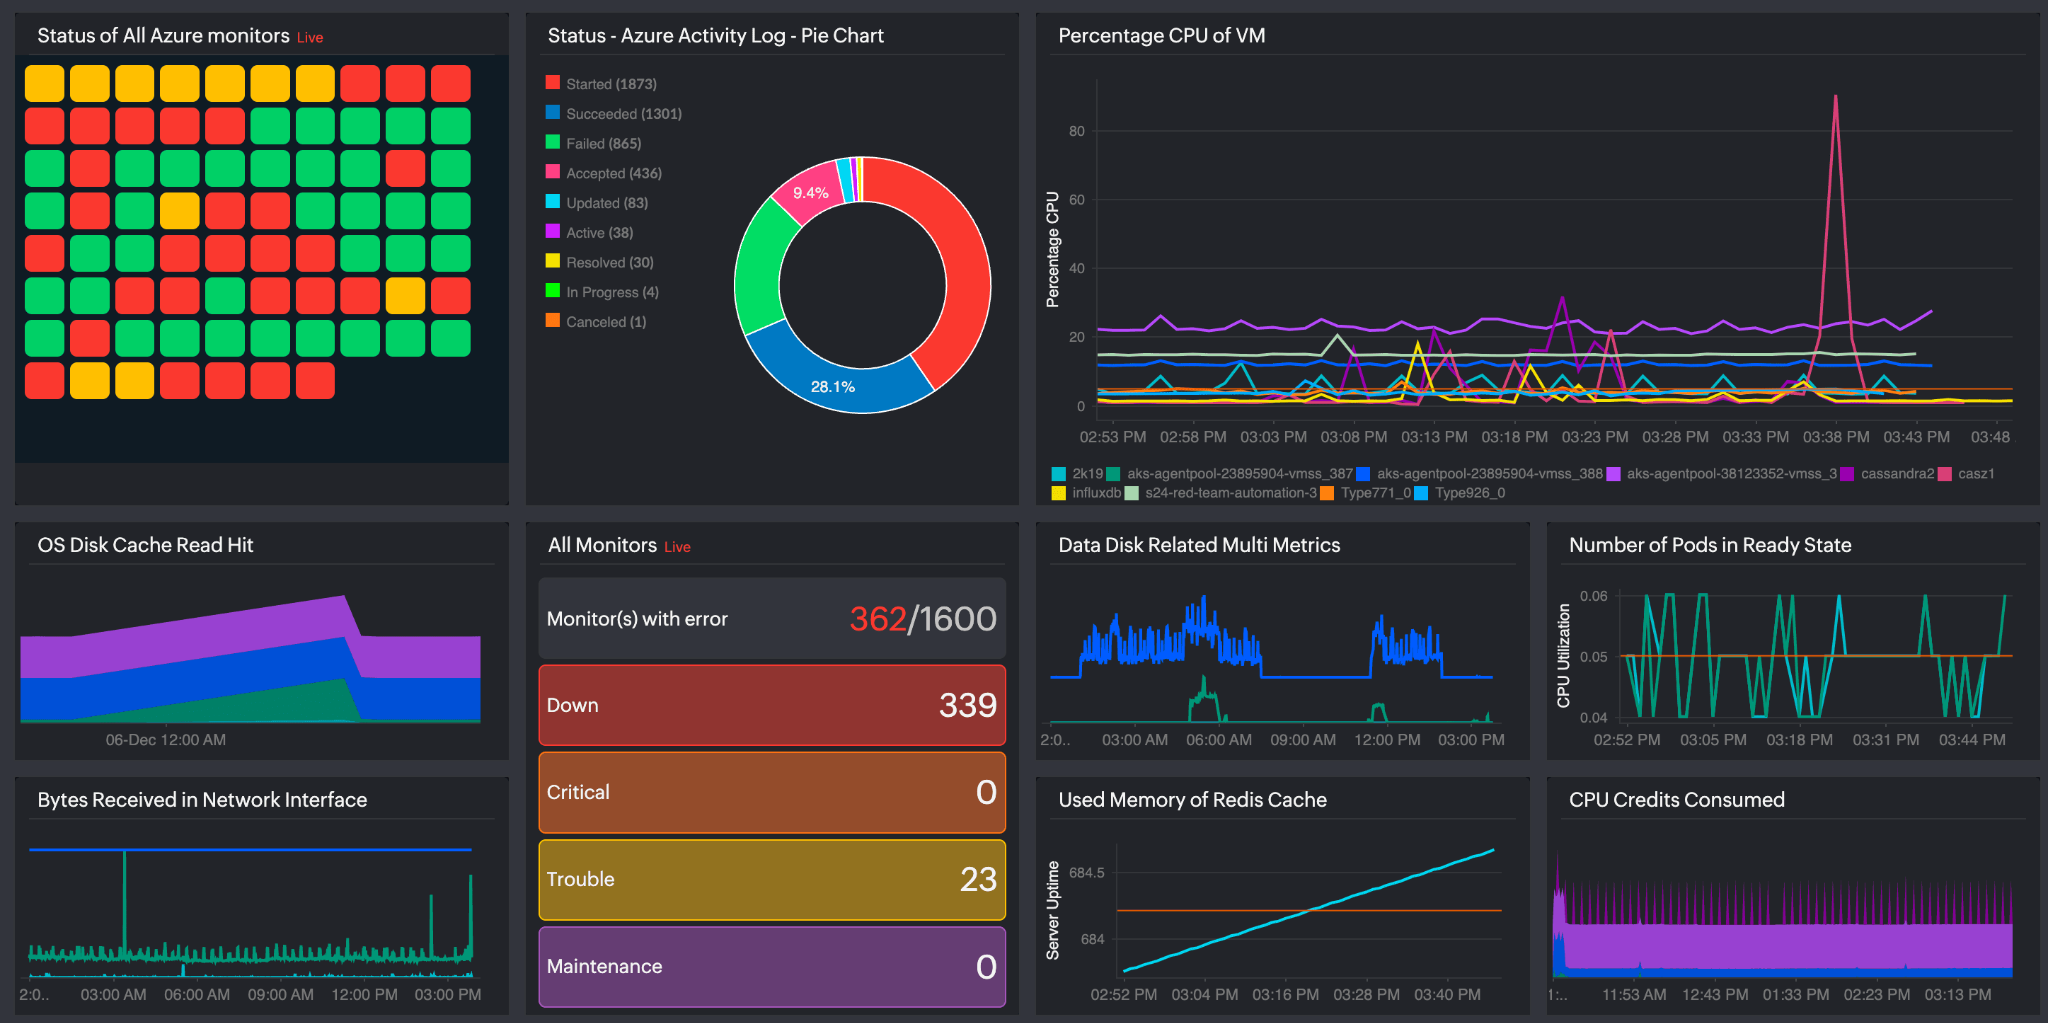
New resources typically appear in the console within 15 to 30 minutes, or immediately when discovery is triggered manually. Its Azure Marketplace listing also means procurement, billing and single sign-on (SSO) can be handled through Azure rather than a separate vendor relationship.
Key features
Zero-touch resource auto-discovery: Detects and adds new Azure resources to monitoring automatically, with a manual "Discover Now" option for immediate onboarding.
Azure Monitor REST API polling: Collects metrics every minute for most resource types, with application status checks every five minutes.
Server Monitoring Extension for VMs: An optional agent adds OS-level process and service visibility beyond what the Azure Monitor API exposes.
Distributed tracing and service mapping: Maps dependencies and traces data flow across microservices in hybrid and multicloud environments.
Guidance Report recommendations: Scheduled, prioritized reports highlighting cost, performance and reliability improvements for the monitored Azure environment.
Pricing
Site24x7 offers a free plan covering uptime monitoring for a limited number of resources.
Azure monitoring itself is priced per resource per month, bundled within its Infrastructure plans.
Best for
Site24x7 suits teams that want broad Azure PaaS and IaaS coverage with automatic discovery and billing through the Azure Marketplace.
Related terms
- Azure monitoring built to keep telemetry in your own tenantAzure monitoring is the practice of collecting and reading metrics, logs and traces from the Azure services your applications run on, from virtual machines and AKS clusters through to App Service, Functions and managed databases, so you can tell whether the platform and the applications on it are healthy.
- BYOCBYOC, Bring Your Own Cloud, is a deployment model where a vendor's software runs inside the customer's own cloud account, operated by the vendor but living on infrastructure the customer owns.
- DatadogDatadog is the largest SaaS observability platform, spanning infrastructure monitoring, APM, logs, RUM, security, and dozens of adjacent products, collected largely through its proprietary agent and priced per product.
- DynatraceDynatrace is an enterprise observability platform known for its OneAgent automatic instrumentation, the Davis AI engine for root cause analysis, and the Grail data lakehouse, sold on a consumption based pricing model.
- Elastic ObservabilityElastic offers observability built on the Elasticsearch stack: log search at its core, with metrics, traces, and APM layered on, available self managed or as the hosted Elastic Cloud.
- GrafanaGrafana is the open source standard for dashboards, and Grafana Labs builds an observability stack around it: Loki for logs, Tempo for traces, Mimir for metrics, with Grafana Cloud as the managed offering.
- New RelicNew Relic is one of the original APM vendors, now a broad all in one observability SaaS covering APM, infrastructure, logs, browser monitoring, and more, priced on data ingested plus per user seats.
- OpenTelemetryOpenTelemetry is an open source framework for generating, collecting, and exporting telemetry: the logs, metrics, and traces that describe how software behaves in production.
- SplunkSplunk is the long standing leader in log analytics and SIEM, acquired by Cisco in 2024, offering log search through its SPL query language plus an observability suite spanning metrics and traces.
- We reviewed 10 AWS monitoring tools engineers actually useThe right AWS monitoring tools for your team depend less on feature lists than on where your telemetry lives, how the bill grows and how much setup you can absorb.