Lexicon · Guide
A practical guide to Kubernetes observability for platform teams
Learn practical Kubernetes observability strategies for platform teams, covering instrumentation, cost control, and how to keep the visibility you need as your cluster grows.
Quick summary
Kubernetes breaks traditional monitoring with ephemeral pods, constantly changing hosts, and rapidly growing label cardinality. This guide explains what observability adds beyond monitoring, how metrics, logs, and traces fit across the cluster, best practices such as OpenTelemetry and SLOs, why costs rise so quickly at scale, and how to keep the data you need without relying on sampling.
Is your Kubernetes observability telling you the truth about your cluster?
Your dashboards are green. Alerts are quiet. Then a pod starts getting OOMKilled every twelve minutes on a node nobody is watching, and the first sign something is wrong is a customer complaint. Kubernetes has a way of making "everything's fine" and "something's badly wrong" look almost identical from the outside.
The problem is that traditional monitoring was built around infrastructure that stayed relatively stable, while Kubernetes is constantly changing underneath you.
In this guide, we'll look at what Kubernetes observability actually means, why Kubernetes breaks traditional monitoring assumptions, and how to build visibility that keeps up as your cluster grows.
What is Kubernetes observability, and how is it different from monitoring?
Kubernetes observability is the practice of collecting metrics, logs, and traces from pods, nodes, and the control plane to understand what a cluster is doing and why. It gives platform teams the context to investigate problems they didn't anticipate, not just the ones a dashboard was already built to catch.
Monitoring and observability are often used interchangeably, but they answer different questions.
Monitoring tracks predefined metrics and triggers an alert when a threshold is crossed, such as CPU usage going above 90%. It tells you something is wrong. Observability goes further. It brings metrics, logs, and traces together to explain why something went wrong, including failure modes nobody thought to define in advance.
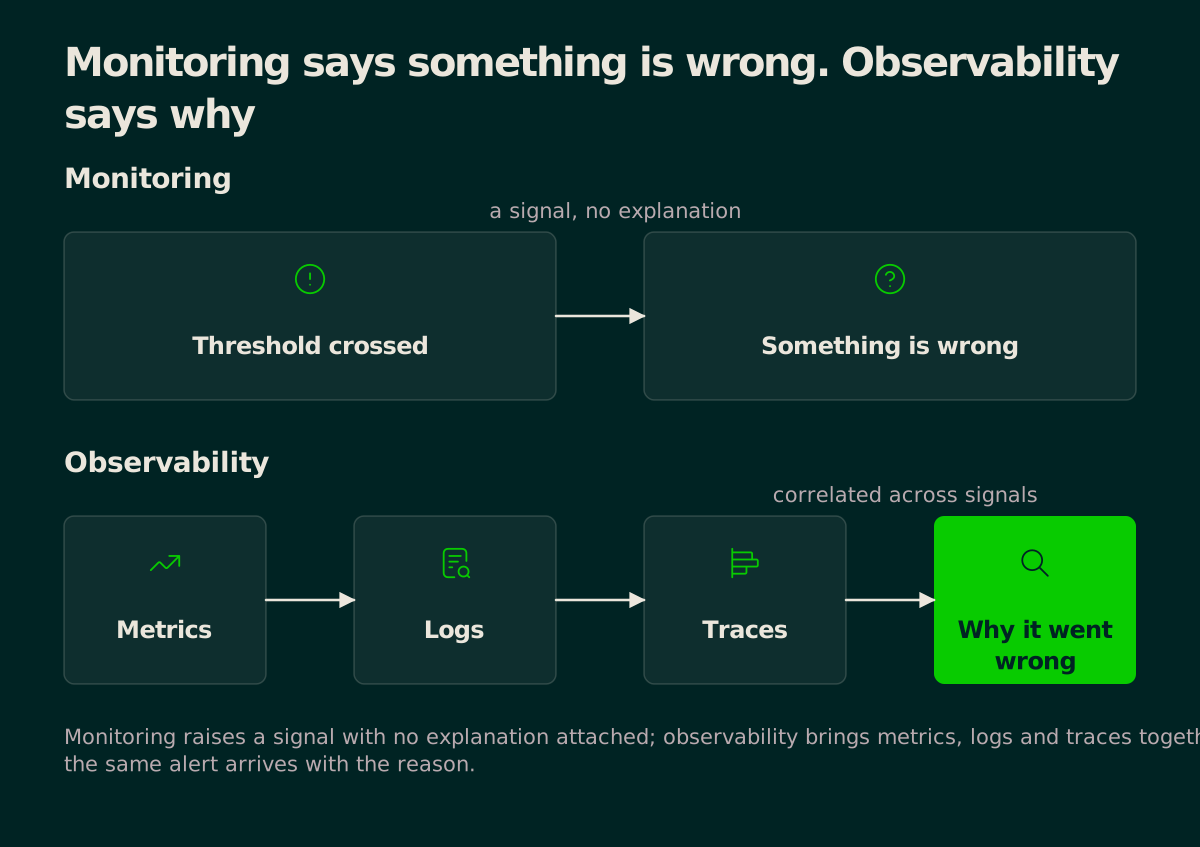
In a nutshell, observability extends monitoring by providing the data needed to understand how and why a problem happened, ideally before it reaches production.
In a Kubernetes cluster, that distinction matters. Pods are ephemeral, IP addresses change, and workloads reschedule automatically, so a fixed set of monitored metrics can become outdated within minutes.
Observability tools built around Kubernetes' API and object model stay current as the cluster changes. They give teams the context to trace a failure back to where it started, rather than watching an alert fire with no explanation. We compare ten of the best Kubernetes monitoring tools in a separate roundup.
Why Kubernetes breaks traditional monitoring assumptions
Traditional monitoring was built for infrastructure that stayed put. Provision a server, install an agent, and watch a handful of metrics for months. Kubernetes removes that stability, and three assumptions break as a result.
No stable host to attach to
Monitoring tools depend on persistent identifiers such as hostnames and IP addresses to track something over time. Kubernetes recycles both constantly. A pod crashes, restarts with a new IP, and any monitoring tied to the old identifier loses the thread.
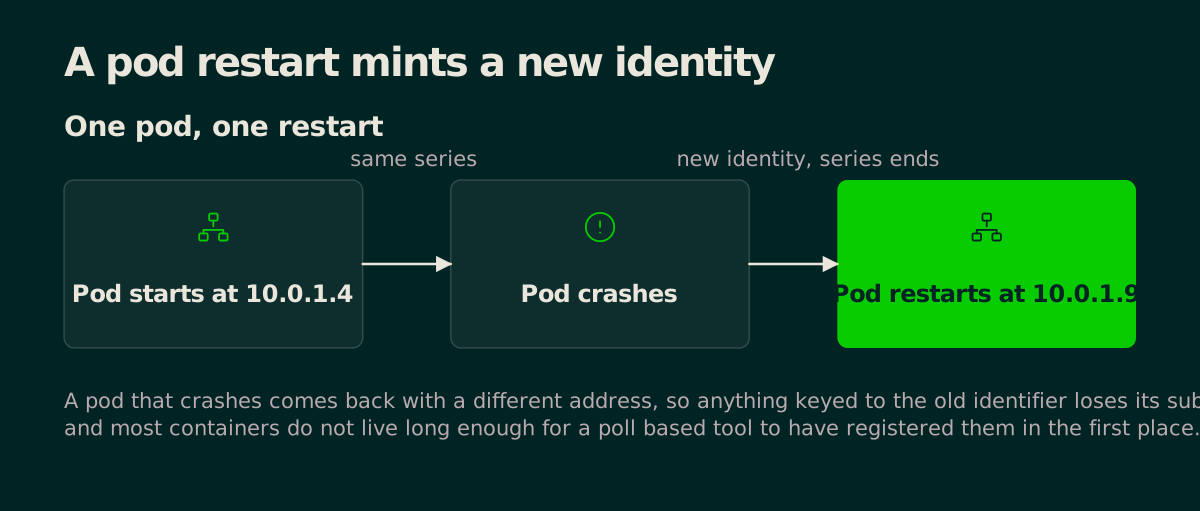
Sysdig's container usage research found 21% of containers live for 10 seconds or less, and 54% live less than five minutes, so a large share of workloads never stick around long enough for traditional monitoring to register them at all.
Workloads too short-lived to observe
Poll-based tools scrape on an interval, usually every 15 to 60 seconds. Pods that live for only a few seconds can start and terminate between scrapes, so metrics like kube_pod_resource_request never capture them. Debug information disappears the same way. Once a pod terminates, its logs and state are gone unless something captured them first.
Label cardinality multiplies without warning
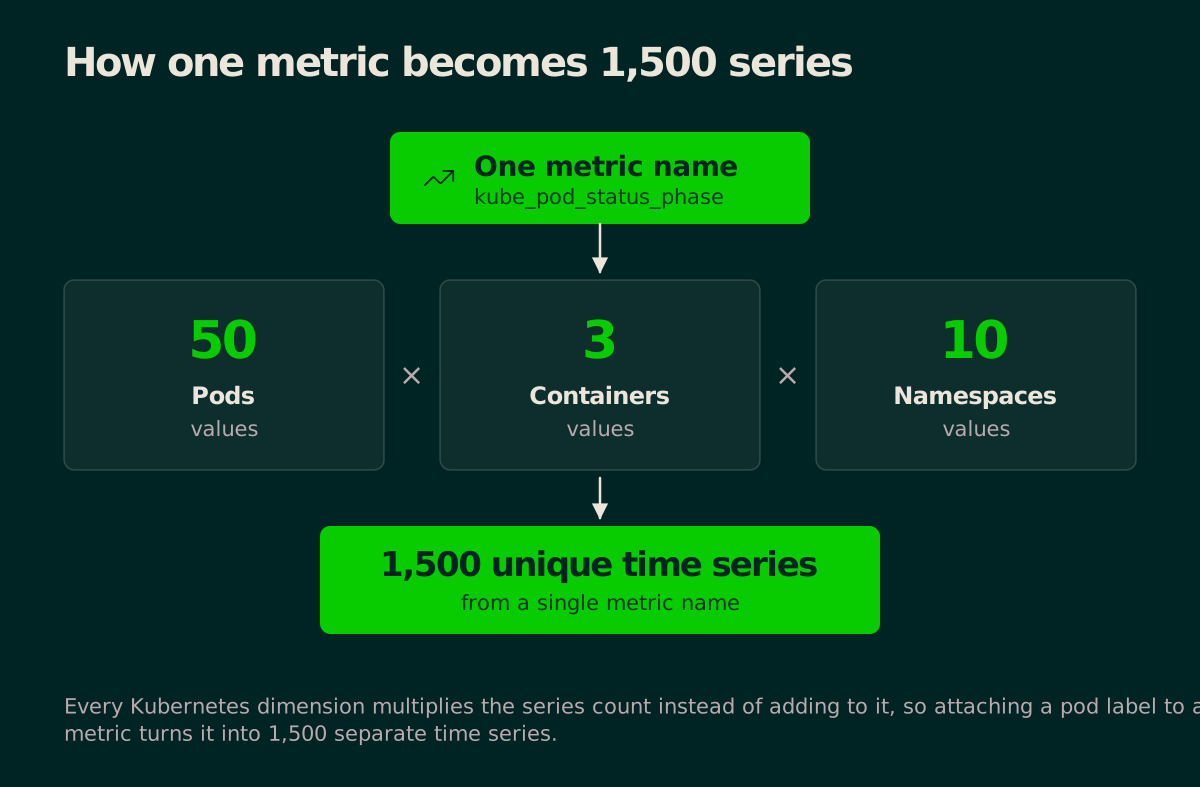
Every unique combination of a metric name and its labels becomes its own time series. Add a pod name label to a metric running across 50 pods, 3 containers, and 10 namespaces, and one metric produces 1,500 separate streams. Scale that across a cluster, and storage costs climb faster than the infrastructure generating them.
Best practices for Kubernetes observability
Good Kubernetes observability comes down to these four decisions.
Instrument with OpenTelemetry
Run a two-tier collector setup:
Agents (DaemonSet, one per node): tag telemetry with pod and node metadata, forward it on
Gateway (Deployment): handles tail sampling, cardinality reduction, and batching before export
Keeping that logic in one tier gives you a single place to manage and understand cost. Tail sampling especially needs a single instance to make consistent decisions across a trace.
Span names need discipline too. A span called process_payment_for_user_jane_doe creates a unique name for every transaction, flooding the backend and making similar operations harder to group.
Move the unique identifier into a span attribute, not the name.
Standardize labels
Labels are where Kubernetes telemetry costs can quickly get out of hand. The kube_pod_status_phase metric creates a new time series as a pod moves from pending to running to failed. In a cluster with heavy pod churn, that adds up fast.
A simple allowlist and denylist keeps this under control:
Two things worth knowing:
Aggregating at the namespace level instead of the pod level removes an entire dimension of multiplication, since pod identity is usually the single largest driver of series count in a cluster.
High-cardinality identifiers such as user_id and request_id belong on logs, not metrics. Dropping a label after ingestion doesn't undo the cardinality it already created. It needs to be stripped before the data reaches the metrics backend.
Define SLOs per service
Tie SLOs to what users actually experience, not just infrastructure thresholds:
Platform SLOs (control plane availability, API server p99 latency) protect tenants
Service SLOs (API response time, error rate) protect end users
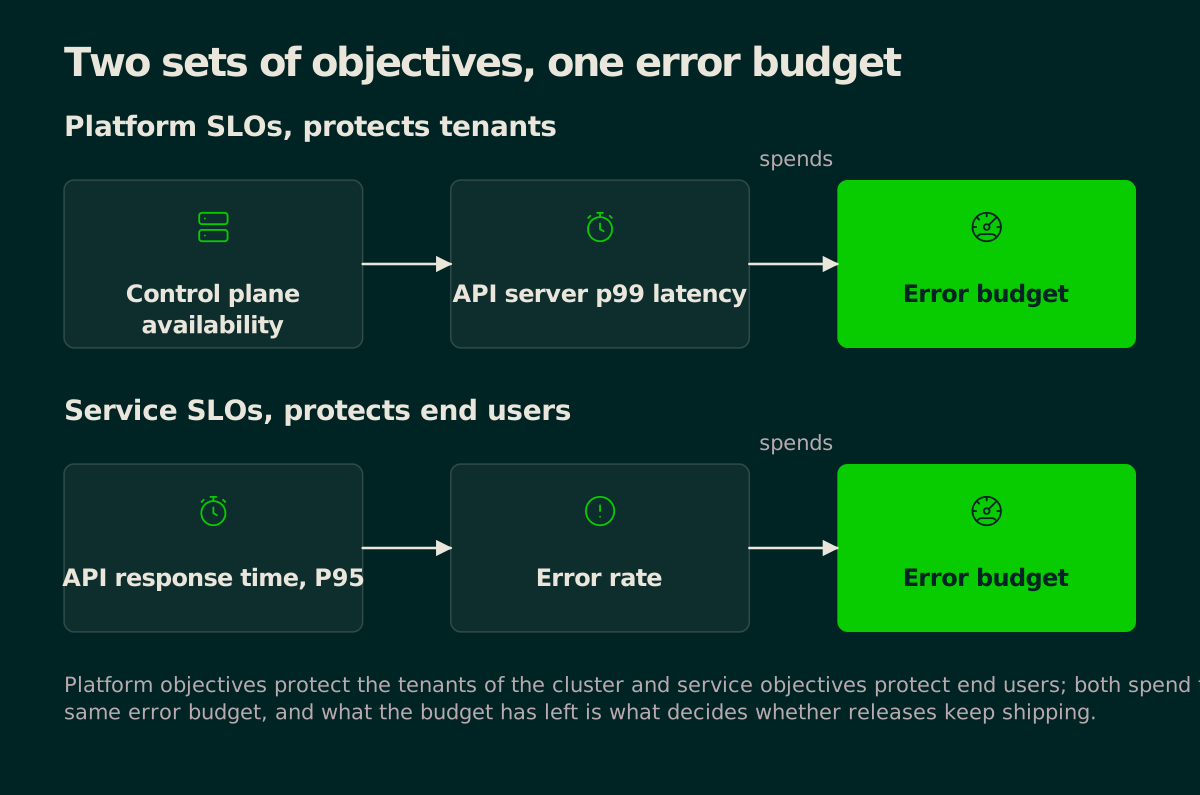
Both matter, but they answer different questions and should be tracked separately. Two rules make SLOs useful:
Use percentiles for latency, not averages. A mean can look healthy while a meaningful share of requests are slow
Define the SLO precisely: what counts as an eligible request, how it's measured, and over what window
Something like "P95 latency under 800ms, 99.9% compliance over 30 days" is specific enough for a team to alert on and act against.
Keep control plane telemetry
The control plane is the part of the cluster teams often stop watching once everything feels stable. That's exactly when it can become useful.
Control plane issues tend to surface here well before applications show any symptoms, which is what makes this telemetry worth keeping even when it feels like noise.
Why Kubernetes observability gets expensive at scale
More pods mean more telemetry
A 50-node cluster can produce 5 to 10 times more metric series than 50 bare-metal servers running the same workloads. The node count hasn't changed. What's changed is how much telemetry is attached to each node. Each one now runs dozens of pods, each pod carries its own labels, and many have sidecars generating their own telemetry streams.
Telemetry volume keeps growing
Demand is rising as architectures add more layers, including containers, sidecars, and service meshes, each generating its own telemetry.
As teams ship more services and add more instrumentation, telemetry volume grows alongside the architecture. Over time, that growth can happen faster than teams expect, even when their monitoring strategy stays the same.
Cardinality drives series growth
Five labels, such as pod, namespace, container, deployment, and version, each with 100 distinct values, can theoretically produce 10 billion unique series. Real clusters rarely reach that ceiling, but they can get close enough for it to matter. A cluster running standard exporters such as node-exporter and cAdvisor can generate 10,000 or more custom metrics before anyone adds application-specific instrumentation.
Pricing turns telemetry into cost
Pricing models react differently as Kubernetes grows:
Misconfigurations can drive costs higher
One team's GCP logging bill reached roughly $800 a day before anyone traced it back to excess log volume from its Kubernetes containers. Fixing the source of the noise instead of adding more infrastructure saved more than $140,000 in logging costs over the following year.
More telemetry means more alerts
As the number of series grows, so does the number of things a threshold-based system can trigger. Teams that haven't brought metrics, logs, and traces into a single pipeline can end up chasing the same incident across three different tools. Every noisy, uncorrelated signal creates another potential page for the on-call team.
How to solve Kubernetes observability challenges without sampling
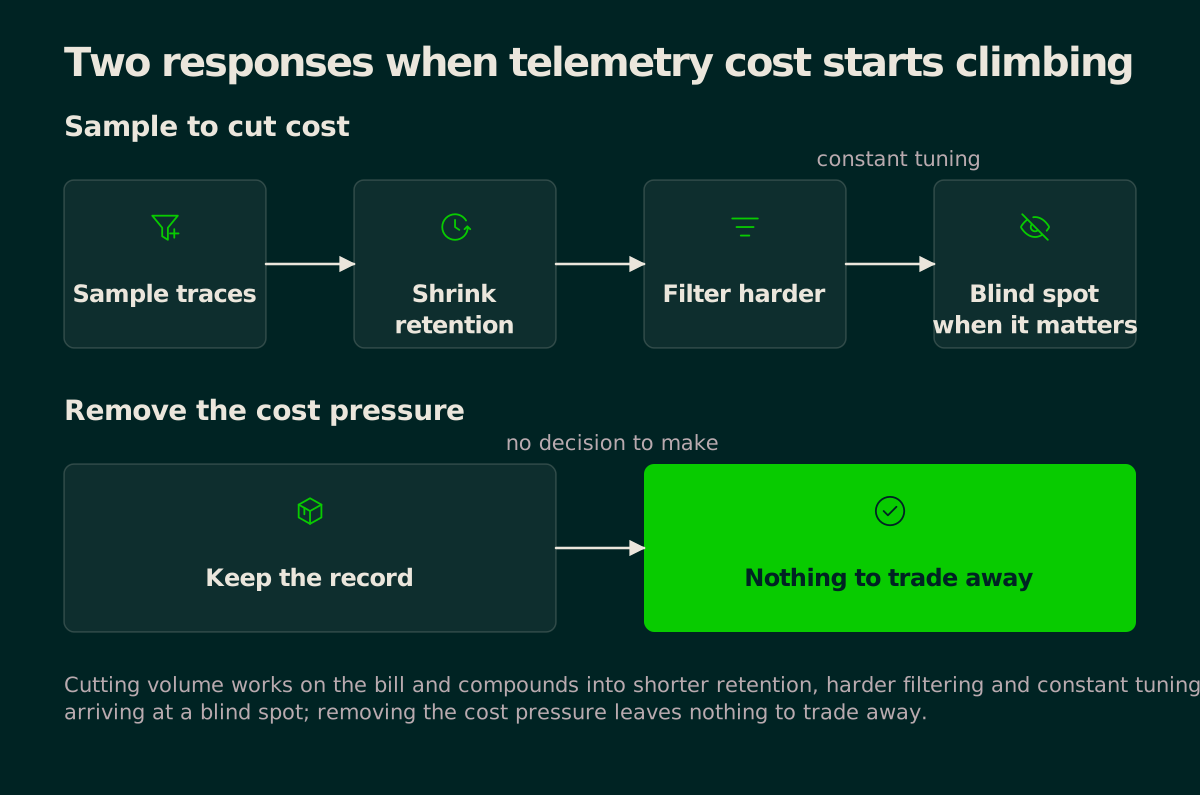
When Kubernetes costs start climbing, the obvious response is to cut volume by lowering log verbosity, increasing trace sampling, or dropping high-cardinality metrics. It looks like the easiest way to bring costs back under control. But it also creates blind spots where you need visibility most.
Sampling can hide the problem
Sample traces at 1%, and you have only a 1% chance of capturing any specific error. That isn't a great position during an incident. A sampler tuned for routine traffic has no way to know which request will time out or which transaction will fail. Outages are rare by definition, so random sampling is least likely to capture them.
Tail sampling captures more, but adds complexity
Tail-based sampling makes better decisions because it waits until a trace completes before deciding what to keep. That means it can retain traces with errors, high latency, or other signals that matter.
The tradeoff is infrastructure. Every span has to be buffered until the decision is made, and all spans from a trace need to reach the same collector instance.
Cost controls create new compromises
Once teams start sampling to manage costs, the pressure usually spreads:
**Shorter retention**: Weeks of data become days, making late-discovered problems harder to investigate.
More aggressive filtering: Entire log streams or regions may get dropped to stay within budget.
Constant tuning: Rules need to change as traffic patterns shift, creating ongoing operational work.
The real issue is the cost model
Observability is meant to help answer questions you didn't know you'd need to ask. Sampling requires you to decide ahead of time which data is worth keeping, even though you can't know what tomorrow's incident will require.
Remove the reason to sample
The alternative isn't simply finding a smarter sampling algorithm. It's removing the cost pressure that makes sampling necessary.
If keeping 100% of your traces, logs, and metrics fits the budget, there's no visibility tradeoff to manage. The question changes from "What can we afford to keep?" to "Why throw any of it away?"
How Tsuga helps with Kubernetes observability
Tsuga removes the cost pressure that makes sampling necessary by changing where Kubernetes telemetry lives.
Your telemetry stays in your cloud
Tsuga deploys observability clusters directly inside your own cloud environment on AWS, Azure, or Google Cloud. Metrics, logs, and traces stay in your own object storage, encrypted with your KMS keys, and never cross into a third-party observability cloud.
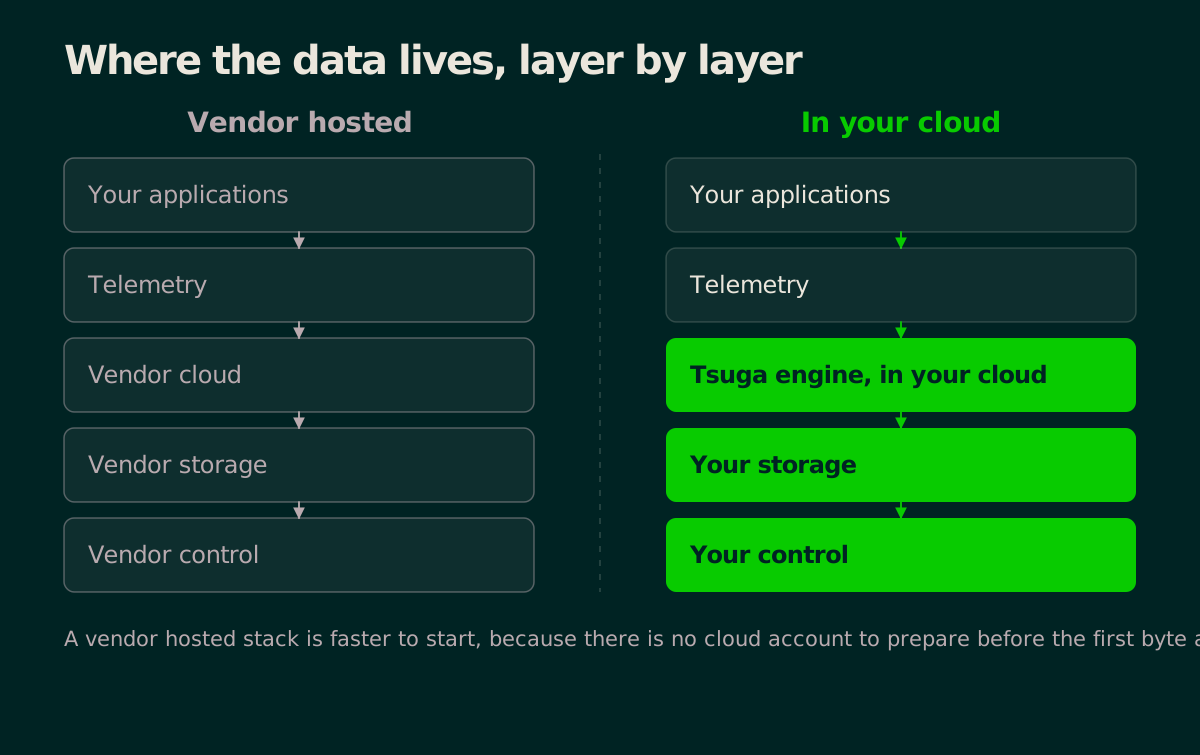
The control plane connects remotely over mutual TLS to manage deployment, upgrades, and scaling, but it never touches your telemetry. Deployment runs through infrastructure-as-code.
This isn't self-hosted open source with a nicer interface. With a self-hosted stack, your team still owns upgrades, scaling, and recovery. Tsuga manages that lifecycle remotely while your data stays on your infrastructure.
You pay for cloud usage
With Tsuga running inside your account, storage goes directly onto your own storage bill and compute runs on your own instances, using your negotiated rates. Reserved instances, committed-use discounts, and existing cloud agreements still apply.
Cardinality stops being a pricing problem
Kubernetes naturally creates high-cardinality data (pod names, namespaces, container IDs, deployment versions, and more). Under per-metric pricing, adding a dimension such as 'tenant' or 'region' can become another line item.
Keep the data you might need
This brings us back to the sampling problem. If keeping 100% of your traces and logs doesn't create a separate cost penalty for cardinality or host count, there's less reason to throw useful data away.
For large Kubernetes estates and multi-tenant platforms, that means teams can keep the telemetry they need and retain it for as long as required.
If your Kubernetes observability costs are growing faster than your cluster, talk to a Tsuga architect about running observability on your own cloud infrastructure.
Related terms
- CardinalityCardinality is the number of distinct values, or distinct value combinations, that an attribute or set of attributes can take.
- Kubernetes monitoringKubernetes monitoring is observability applied to Kubernetes clusters: the nodes, workloads, pods, and containers that run modern applications, plus the control plane that orchestrates them.
- ObservabilityObservability is the ability to understand what is happening inside a system from the data it emits: its logs, metrics, and traces.
- OpenTelemetry CollectorThe OpenTelemetry Collector is a standalone process that receives telemetry from applications and infrastructure, transforms it, and exports it to one or more destinations.
- SamplingSampling is the practice of keeping only a subset of telemetry, usually traces, so that volume and cost stay manageable.
- SLOAn SLO, service level objective, is a target for how reliable a service should be, expressed as a measured indicator held over a time window: 99.9 percent of requests succeed over 30 days, or 95 percent of checkouts complete in under two seconds.
- The complete guide to Kubernetes application monitoringKubernetes application monitoring means collecting and reading telemetry from the workloads running on a cluster rather than from the cluster itself.