Lexicon · Guide
LLM observability explained: how to monitor performance, quality and cost
LLM observability shows whether your AI answers are right, fast and affordable. What to capture, how OpenTelemetry names it, and how to keep it in your cloud.
Quick summary
LLM observability tells you whether your AI application is fast, reliable, useful and affordable in production, which uptime and error rates alone cannot. It tracks prompts, completions, tokens, latency, cost, retrieval, tool calls and quality signals, and OpenTelemetry now gives that data a shared vocabulary. Good practice keeps drift, volume, privacy and spend under control, and with Tsuga the telemetry stays inside your own cloud account, under your control.
What is LLM observability, and how does it differ from traditional APM?
LLM observability shows how a language model application behaves in production. It is part of broader AI observability, which connects model activity with agents, applications, infrastructure and cost, and it lets you inspect quality, speed, token use, retrieval and tool calls inside each request.
Traditional application performance monitoring was built for predictable software. It measures request rates, errors, latency and resource use, and those signals still matter for an LLM application, but they cannot tell you whether an answer was correct or useful.
An LLM call can return 200 OK while giving a false answer. It can produce prose when a downstream service expects JSON, or stop early because it reached its output limit, and standard APM records a successful request in every one of those cases.
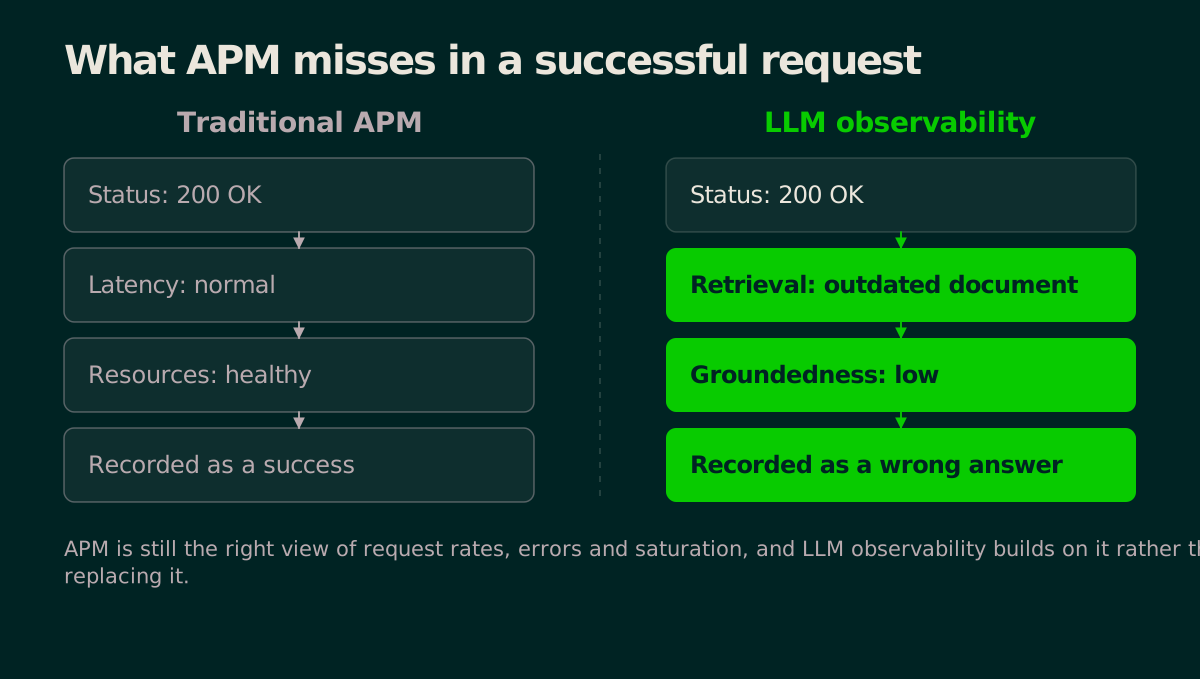
LLM observability adds semantic signals to the usual logs, metrics and traces. Common examples are groundedness, relevance, safety, format validity and task completion, and quality becomes a range of scores rather than a single pass or fail.
Debugging changes too. A normal stack trace points to a file and a line number, but an LLM trace has to show the evidence around the model call. For a retrieval augmented generation workflow, that evidence includes:
the user input and the prompt template version
the query sent to the retriever
the returned documents, with their ranks and scores
the model and its generation settings
the completion and its finish reason
any tool calls, results and retries
Imagine a support assistant that quotes an outdated refund policy. The model responds quickly, so standard APM sees nothing wrong, but the LLM trace shows that retrieval handed the model an old policy document. Your engineers fix the document index instead of changing the model.
LLM observability best practices
Telemetry earns its keep when you can turn it into better tests, safer releases and faster incident response. These four practices are where that happens.
Build a baseline for each use case
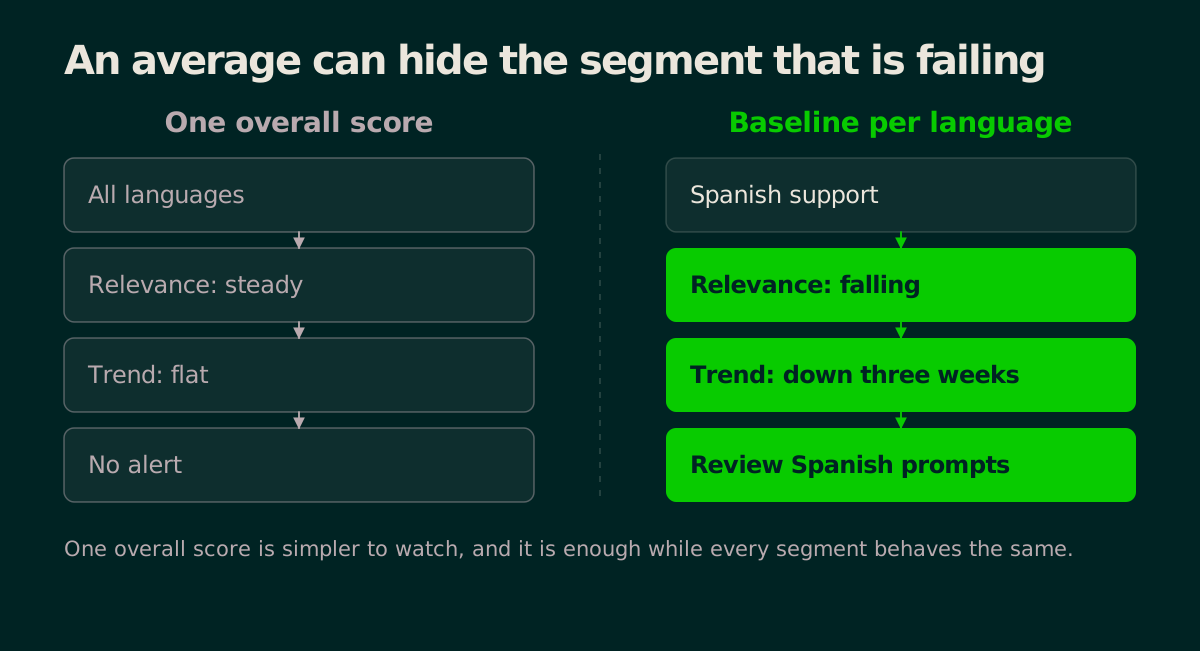
Expected performance varies by task, language, customer group and model version. Build separate baselines from reviewed test cases and production traffic, and track the normal ranges for quality, latency, token use and task completion.
An overall relevance score can hold steady while Spanish support answers decline. Segmenting results by language exposes the problem and narrows the review to the prompts and sources that are actually affected.
Turn production failures into test cases
Production traffic reveals inputs that pre-release testing missed. After each incident, add the reviewed failures to a regression dataset so they are tested from then on.
Suppose an invoice assistant misreads "1,250.00" for users in one locale. Save a safe version of the input, the expected result and the evaluation rule, then test every future prompt, model and retrieval change against it, so the same error cannot quietly return.
Use canary releases and quality gates
Test each new version against a fixed evaluation dataset. If it passes, send a small share of production traffic to it and keep the rest on the current version for comparison, measuring both across four areas:
Task success: did users complete the action they came for?
Response quality: was the answer accurate and grounded?
Performance: did latency or time to first token increase?
Cost: did cost per completed task change?
A cheaper model can produce weaker answers and trigger more retries, so cost per request falls while cost per successful outcome rises. Set your release limits before the test starts, pause the rollout if task success falls, harmful responses increase or costs rise sharply, and keep the earlier version ready for a fast rollback.
Connect alerts to a clear response
An alert should name the affected workflow and point the investigation somewhere useful. Include the prompt version, the model, the most recent deployment and a few example traces.
Match the response to the signal. More retrieval misses point to the index or the query logic, repeated tool calls may need a step limit, and more truncated responses may mean the output limit is too low. Review your alerts after each incident, remove the noisy ones and sharpen the ones that missed a real user problem.
The biggest challenges in LLM observability
Detailed traces are what let you explain unusual model behavior. They also raise storage costs, query load and data risk, and these four pressures are where most teams feel it first.
One request can produce a large trace
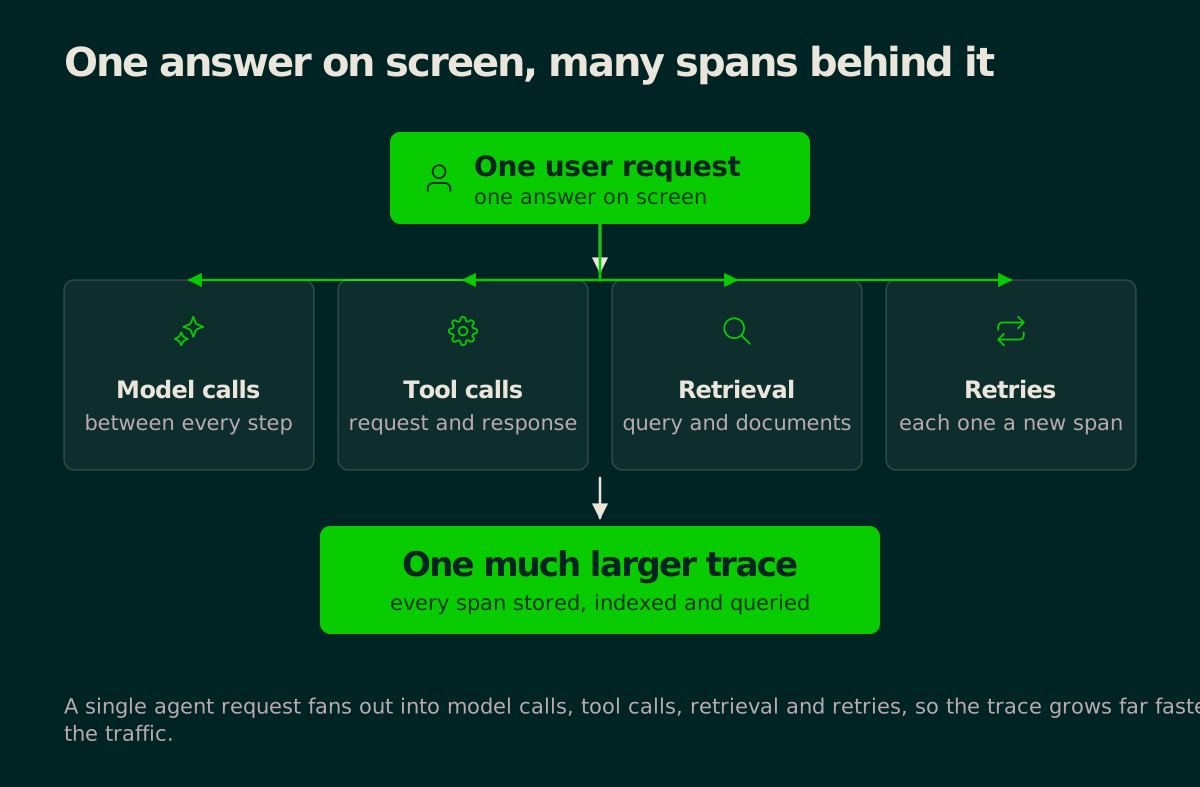
Consider an agent that needs five tool calls to finish one task. Each call creates a request and a response, and the model may run between calls, so the user sees one answer while your observability platform receives a much larger trace.
Retries add volume on top of that, and streaming can create many small records if each output chunk is stored separately. Measure the stream as it arrives and store the completed response once, which preserves time to first token and total generation time with far fewer records.
High cardinality can overwhelm metrics
Cardinality is the number of unique label combinations in a metric, and LLM applications add labels such as model, agent, prompt version, tenant and finish reason. Five models, eight finish reasons, four customer tiers and 52 prompt versions already make 8,320 possible series, and adding 200 tenants raises the upper bound to 1.6 million.
Keep request IDs, session IDs, prompts and document IDs out of metric labels and store them in traces or logs instead. Reserve labels for controlled values such as model name and operation type.
Detailed logging can follow token costs
Long prompts use more model tokens and create more content to store. Agent workflows raise model and telemetry costs together, because one user request can trigger several model calls.
You can limit the effect in three ways. Measure the full run by rolling token use and cost up to the root request, detect unusual sessions by alerting when a run exceeds its normal token, step or cost range, and set firm limits that stop an agent when it reaches its budget. Keep full traces for errors, expensive sessions and low-quality outputs, and give routine successful requests shorter retention or sample them.
Sensitive content restricts data capture
Prompts and tool results can contain personal data, source code or internal instructions. Full capture makes debugging easier, and it also raises your security and compliance risk.
Store raw content separately from searchable metadata, with tighter access controls and shorter retention. When full content cannot be stored at all, add a protected reference or a prompt hash to the trace, so your engineers can still connect related events without exposing sensitive text in the main telemetry system.
How Tsuga supports LLM observability at scale
LLM workloads create dense, sensitive telemetry that gets expensive to store and hard to govern. We built Tsuga as managed Bring Your Own Cloud observability, and these five pieces are how that answers each of those pressures.
Keep sensitive LLM context inside your own cloud account
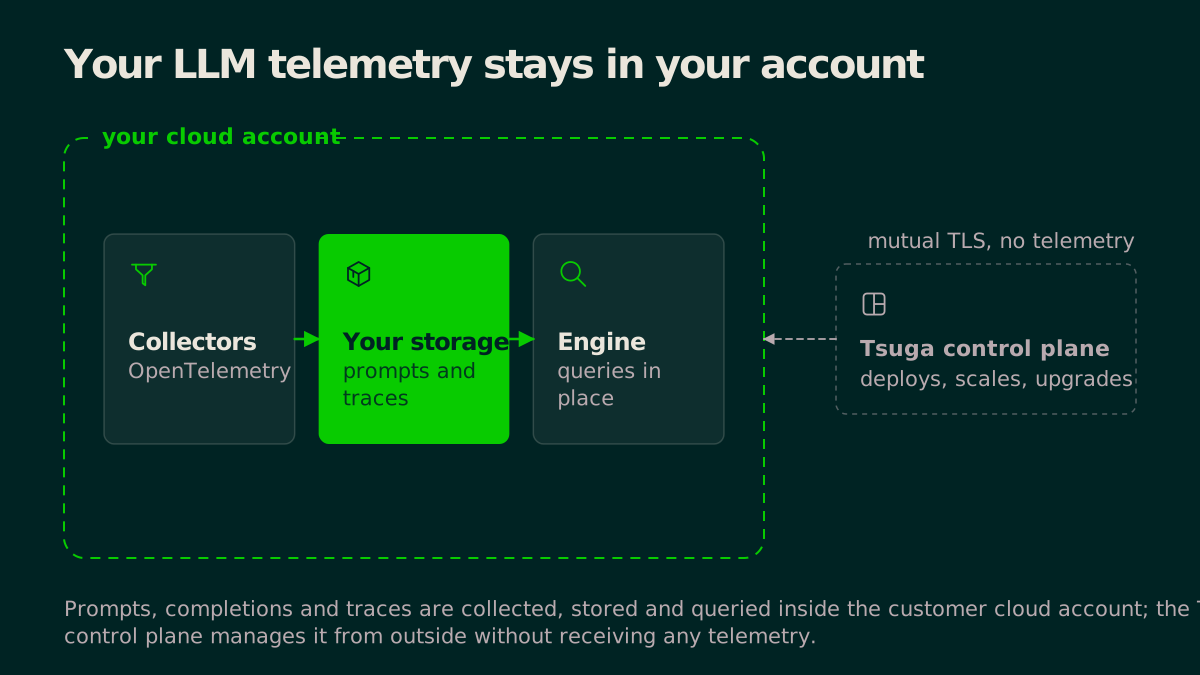
Our data plane runs inside your own AWS, Azure or Google Cloud account. Prompts, completions, retrieved context and tool payloads stay in your object storage, protected by your own encryption keys and access policies.
A separate control plane manages deployment, scaling, updates and recovery over mutual TLS without ever ingesting your telemetry. You keep the context your engineers need for debugging while sensitive LLM data stays inside your cloud perimeter and your chosen region.
Scale storage on your own cloud bill
A single agent run can create several model, retrieval and tool spans. As those traces grow, the Tsuga Engine processes them on your own instances and stores them in your own object storage.
The compute and storage behind that show up directly on your cloud bill, at your provider's rates. You can see exactly what richer agent traces cost you, rather than finding out through a separate line on an observability invoice.
Control trace volume before storage
Our observability pipeline filters, transforms and routes LLM telemetry before it reaches storage. Built-in rules remove repeated streaming events, unnecessary tool payloads and other low-value data.
Automated quality reports also identify high-cardinality tags and unused metrics. You can retain full traces for failed, costly or low-quality runs while giving routine traffic shorter retention or sampling.
Trace AI failures across the wider stack
Tsuga puts agent call graphs beside your application traces, logs and infrastructure metrics. Your engineers can follow a low-quality response through retrieval, model calls and tools into the services they reached.
A cost spike may lead back to a repeated tool call, and a quality regression may line up with an index update or an infrastructure change. The more of that detail you choose to keep, the more your root cause analysis has to work with.
Adapt the setup as LLM workloads grow
We work alongside your team to tune pipelines, retention and access controls as your workloads change. Because the storage is yours, cutting telemetry noise lowers your own cloud bill directly, and our job is to help you drop what you do not need while keeping the evidence your engineers do.
If you want your LLM telemetry visible, affordable and under your control, talk to a Tsuga architect. We will walk through what your workloads produce and what it would take to keep all of it in your own account.
Related terms
- CardinalityCardinality is the number of distinct values, or distinct value combinations, that an attribute or set of attributes can take.
- OpenTelemetryOpenTelemetry is an open source framework for generating, collecting, and exporting telemetry: the logs, metrics, and traces that describe how software behaves in production.
- SamplingSampling is the practice of keeping only a subset of telemetry, usually traces, so that volume and cost stay manageable.
- Semantic conventionsSemantic conventions are OpenTelemetry's standard vocabulary: the agreed names, types, and values for the attributes that describe telemetry.
- SpanA span is a single timed operation inside a trace: an HTTP request, a database call, a queue publish, or an internal step worth measuring.
- TraceA trace is the end to end record of one request or workflow as it moves through a system, composed of all the spans that share a single trace ID.