Lexicon · Guide
We reviewed 10 reliable LLM observability tools for production teams in 2026
Ten LLM observability tools compared on deployment, signals, pricing model and fit, so you can choose the one that suits your agents, volume and data rules.
Quick summary
The top LLM observability tools are Tsuga, Langfuse, LangSmith, Datadog, Arize Phoenix, Helicone, W&B Weave, Braintrust, Dynatrace and HoneyHive. Together they cover managed bring your own cloud (BYOC), open-source tracing, gateways, evaluations and enterprise observability in production. Our top three picks are Tsuga for regulated, high-volume teams, Langfuse for open-source, self-hosted workflows, and LangSmith for LangChain and LangGraph teams.
1. Tsuga
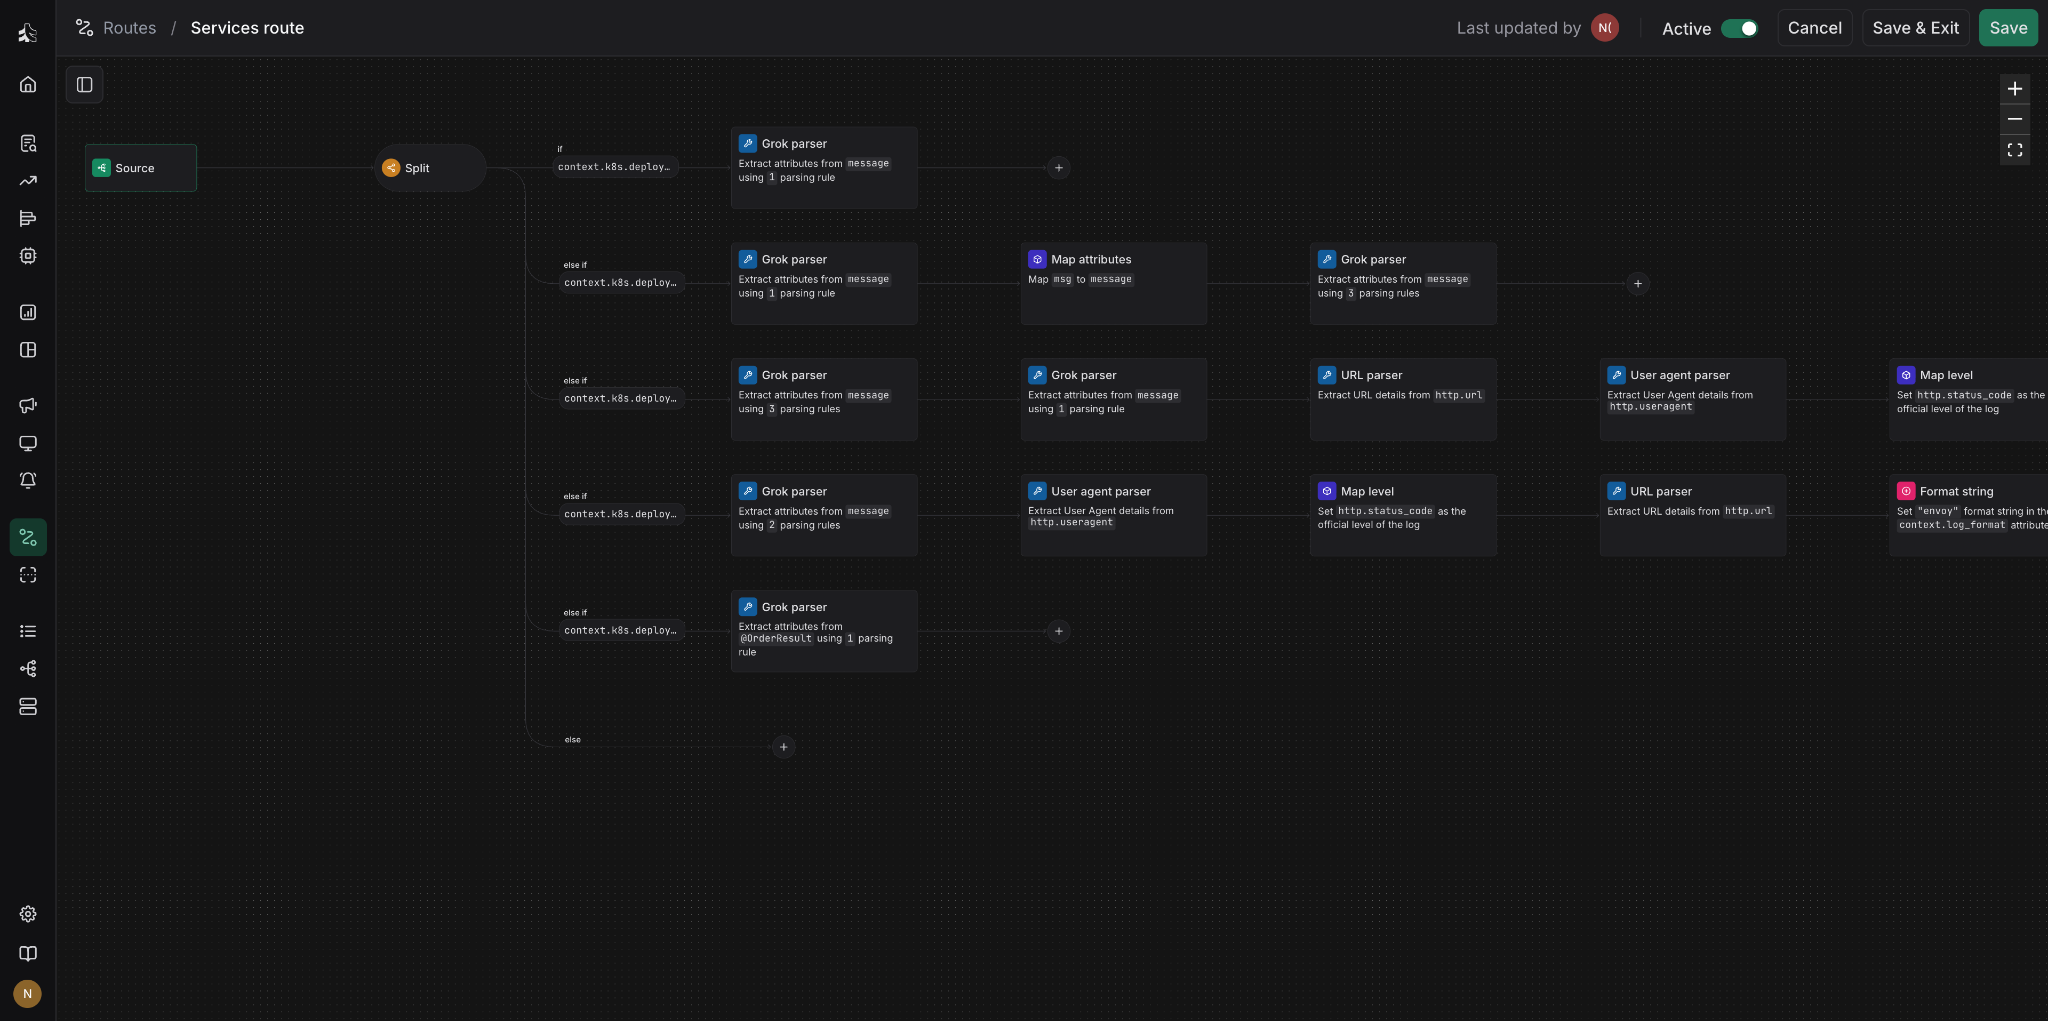
We approach LLM observability as a scale and data sovereignty problem. Our managed BYOC model places the observability infrastructure beside the agents producing the telemetry, while we handle the platform lifecycle. That suits environments where prompts, decision trails and operational context must stay queryable without leaving your own cloud.
Key features
Managed data plane in your cloud: Storage, indexing and processing run in your own AWS, Azure or Google Cloud account, and we manage scaling, upgrades and reliability.
Agent-first query interfaces: An MCP server, a CLI and APIs return the relevant operational context, so agents can investigate incidents without processing large raw data dumps.
Correlated system telemetry: Explore logs, metrics and traces together, connecting LLM behavior with the applications and infrastructure supporting it.
Ingest-time pipeline controls: Filter, enrich, normalize and route telemetry before storage, which keeps noisy data in check as agent activity grows.
Sensitive telemetry protection: The pipeline can detect and redact personally identifiable information (PII), credentials and regulated fields before storage, and stored data is encrypted under your own key management service (KMS) keys.
Pricing
Storage and compute run in your own cloud account, so they show up directly on your cloud bill, at your provider's rates. To see what that means for your volumes, talk to an architect, who can model it against your actual traffic.
Best for
Tsuga suits large-scale or regulated teams that need managed LLM observability inside their own cloud boundary. If you run a single model call at modest volume and your prompts carry nothing sensitive, a lighter developer tool may be all you need today.
2. Langfuse
Langfuse is an open-source AI engineering platform that connects production observability with continuous LLM application improvement. It helps teams investigate unpredictable model behavior, reproduce failures and validate changes within a shared workflow, and flexible deployment options give organizations more control over where observability data resides.
Key features
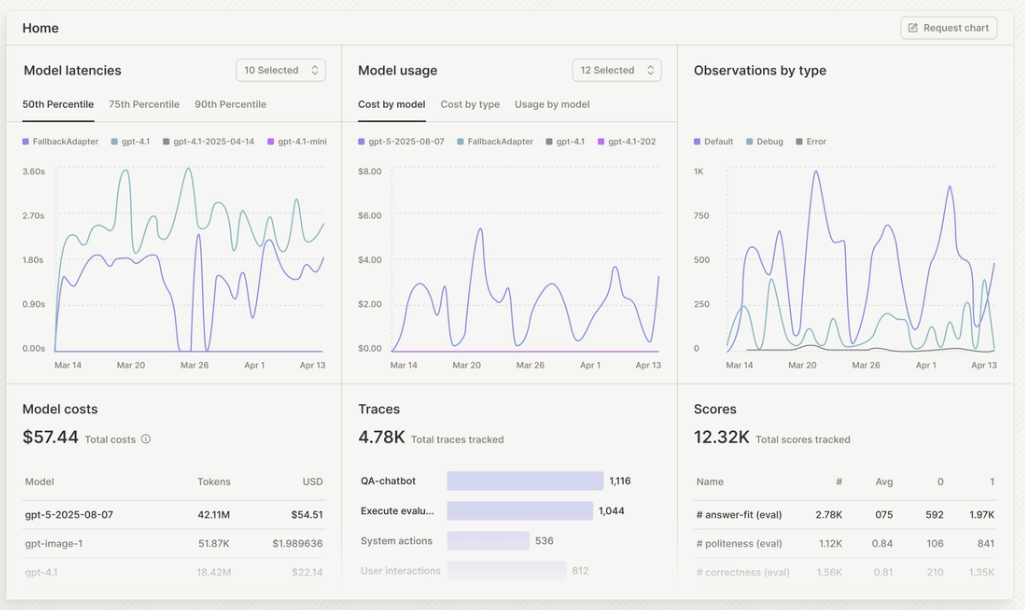
End-to-end LLM tracing: Captures prompts, responses, retrieval steps, embeddings, tool calls, token usage and latency within nested request timelines.
Session and agent views: Groups traces into multi-turn sessions and visualizes agent workflows, so you can follow behavior across longer interactions.
Integrated quality evaluation: Scores development and production traces using LLM judges, code-based checks, user feedback, manual labels or external pipelines.
Trace-linked prompt management: Versions and deploys prompts, connects them with production traces and supports comparisons across prompt changes.
Open, portable instrumentation: Collects telemetry through native software development kits (SDKs), OpenTelemetry and more than 100 integrations, with cloud-hosted and self-hosted deployment options.
Pricing
Langfuse offers free cloud and self-hosted options for LLM tracing, cost tracking and evaluations. Paid cloud plans are a monthly subscription that then scales with usage, and teams needing advanced controls and support can choose higher cloud tiers or a custom-priced deployment.
What users are saying
On Product Hunt, users praise Langfuse for its tracing, integrations, SDKs and self-hosting support, and some say it works well for production observability and debugging. Others find complex agent traces hard to follow, while a few people on Reddit reported limited value as their needs grew.
Best for
Langfuse suits teams wanting a broad, open-source LLM engineering workflow they can self-host. Running it at production scale means owning that deployment, so it fits best where a team is ready to operate it.
3. LangSmith
LangSmith gives teams one workspace for examining agent behavior from development through production. Production runs become evidence your team can inspect, test and use to improve later releases. The platform supports many frameworks, and its close fit with LangChain and LangGraph gives it a clear place in their agent development stack.
Key features
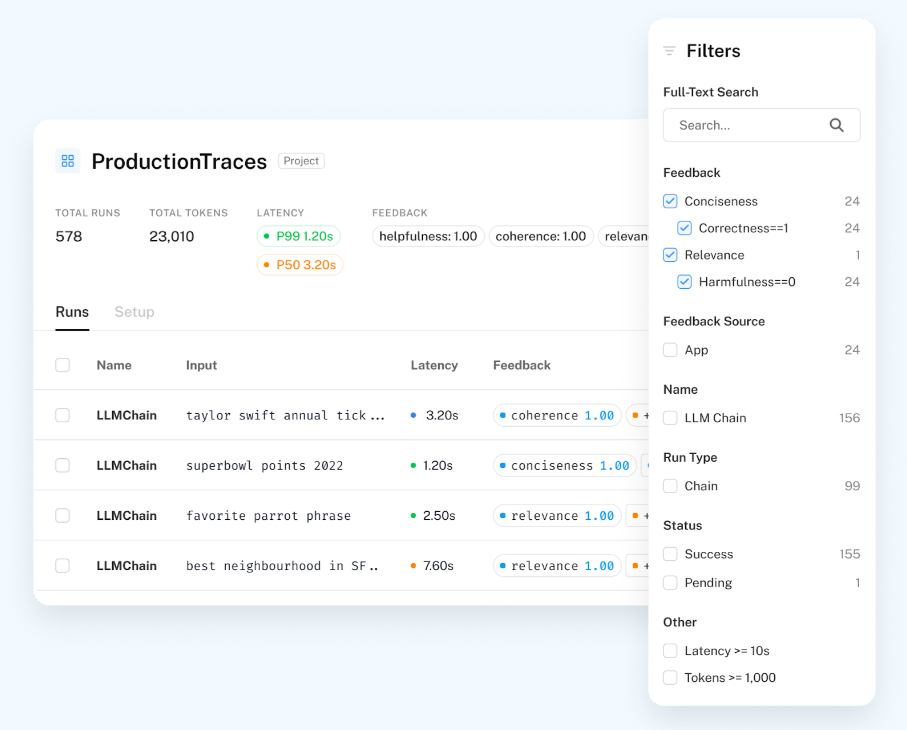
Nested execution traces: Maps requests across model calls, retrieval, tools and agent steps, so developers can see where a failure or poor output began.
Thread-aware investigation: Presents related runs through message, turn and detail views, which helps when debugging full conversations and multi-step workflows.
Production dashboards and alerts: Tracks errors, latency, token use, costs, tool behavior and feedback scores, with alerts to catch emerging problems early.
Connected online and offline evaluation: Scores live traffic, moves failed traces into datasets and reruns tests before release to catch regressions.
Automated issue analysis: LangSmith Engine finds recurring trace failures, studies their likely causes and helps teams turn production problems into focused fixes.
Pricing
LangSmith offers a free single-user option with a monthly trace allowance. Team access is priced per seat per month, with an included trace allowance before usage charges apply, and organizations needing self-hosting, stronger security or custom trace volumes receive tailored pricing.
What users are saying
Although LangSmith has limited third-party review, most users like the detailed call-chain tracing, Python SDK and automated evaluations, especially in continuous integration and delivery (CI/CD). Some teams on Product Hunt and Gartner note cumbersome data workflows and limited filtering, while some Reddit users report slow pages.
Best for
LangSmith suits teams building and monitoring production agents with LangChain or LangGraph. Teams on other frameworks can use it too, though they give up some of the fit that makes it stand out.
4. Datadog LLM Observability
Datadog places its LLM Observability capabilities within its wider Agent Observability product. It brings AI monitoring into the same workflow teams use for production applications, so AI engineers, developers and site reliability engineers (SREs) can investigate model behavior without separating AI incidents from wider software issues.
Key features
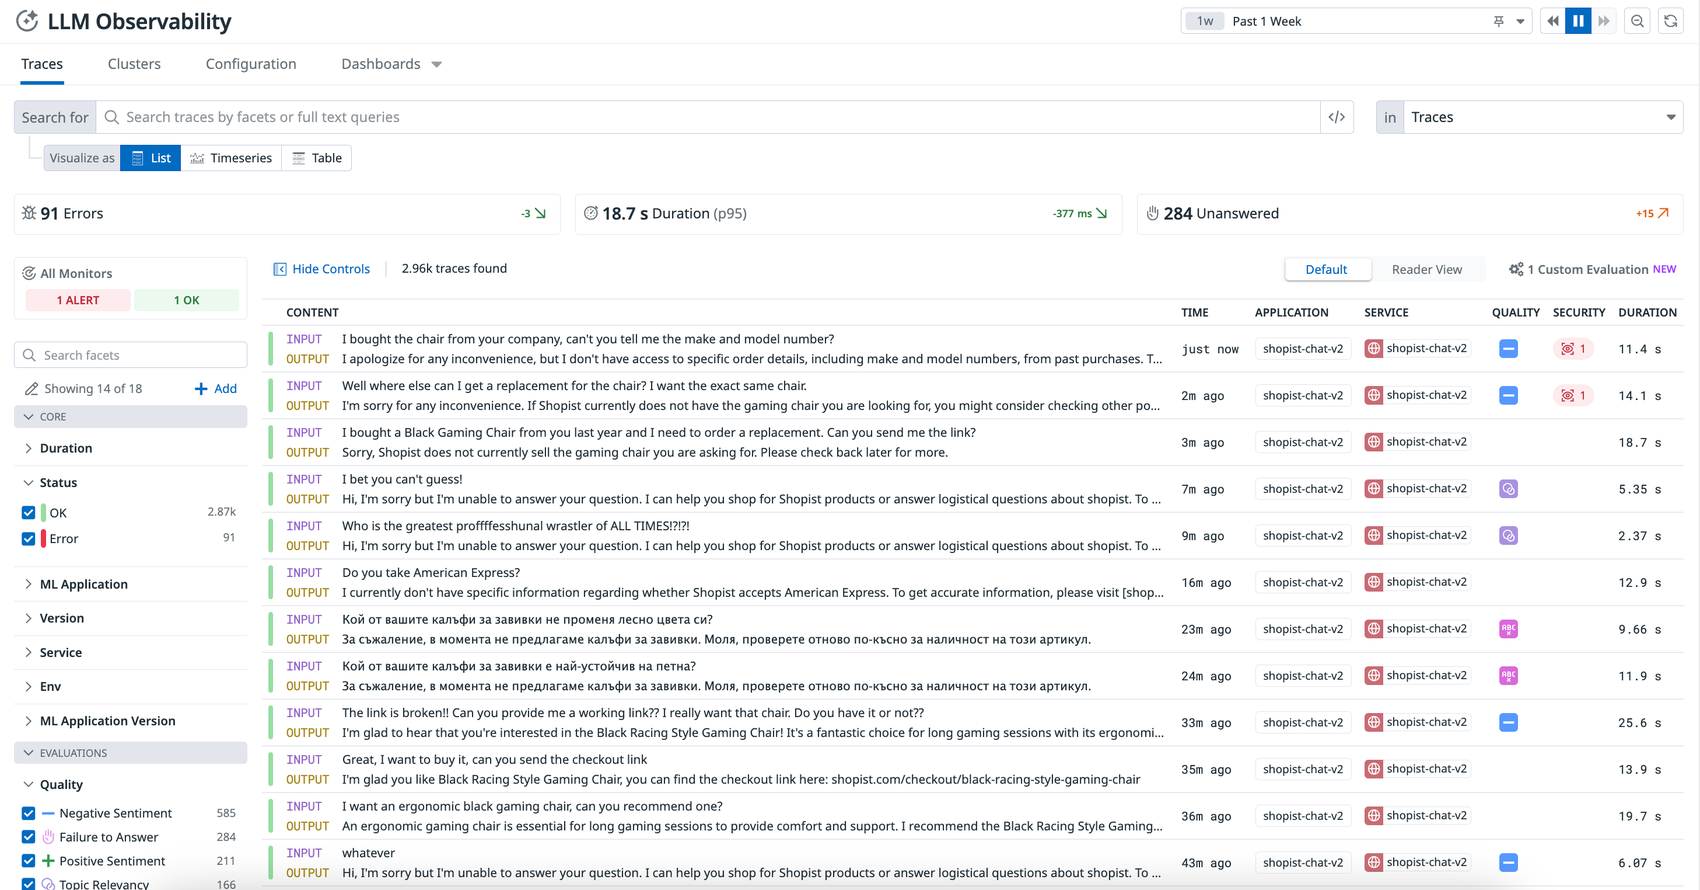
Cross-stack request correlation: Links LLM spans with application performance monitoring (APM) services, infrastructure signals and real user monitoring (RUM) sessions, so you can trace problems across the full application stack.
Step-level agent tracing: Follows prompts, retrieval, tool calls and agent decisions, tracking latency, tokens, retries and errors at each step.
Quality and safety evaluations: Uses built-in or custom evaluators to detect hallucinations, prompt injection, PII exposure and changes in output quality.
Production-grounded experiments: Converts annotated traces into versioned datasets, so you can compare prompts, models and agent configurations using real production cases.
Operational monitoring and alerts: Tracks cost, quality, latency, reliability and tool behavior, and helps you catch changes before they affect more requests.
Pricing
Datadog offers free LLM observability up to a monthly span allowance, with paid plans priced by the number of LLM spans. Billing counts only calls to LLM providers, while tool, workflow, agent, embedding and retrieval spans remain unbilled.
What users are saying
Dedicated LLM Observability reviews remain scarce. Across more than 1,500 Gartner ratings, Datadog scores 4.5 out of 5, with reviewers valuing unified monitoring and faster diagnosis. Common concerns include setup effort, noisy data, and pricing that becomes harder to predict as usage grows.
Best for
Datadog suits existing Datadog users connecting LLM behavior with application, infrastructure and user experience monitoring. It is strongest when you want breadth from one vendor and are comfortable with telemetry stored in the vendor's cloud.
5. Arize Phoenix
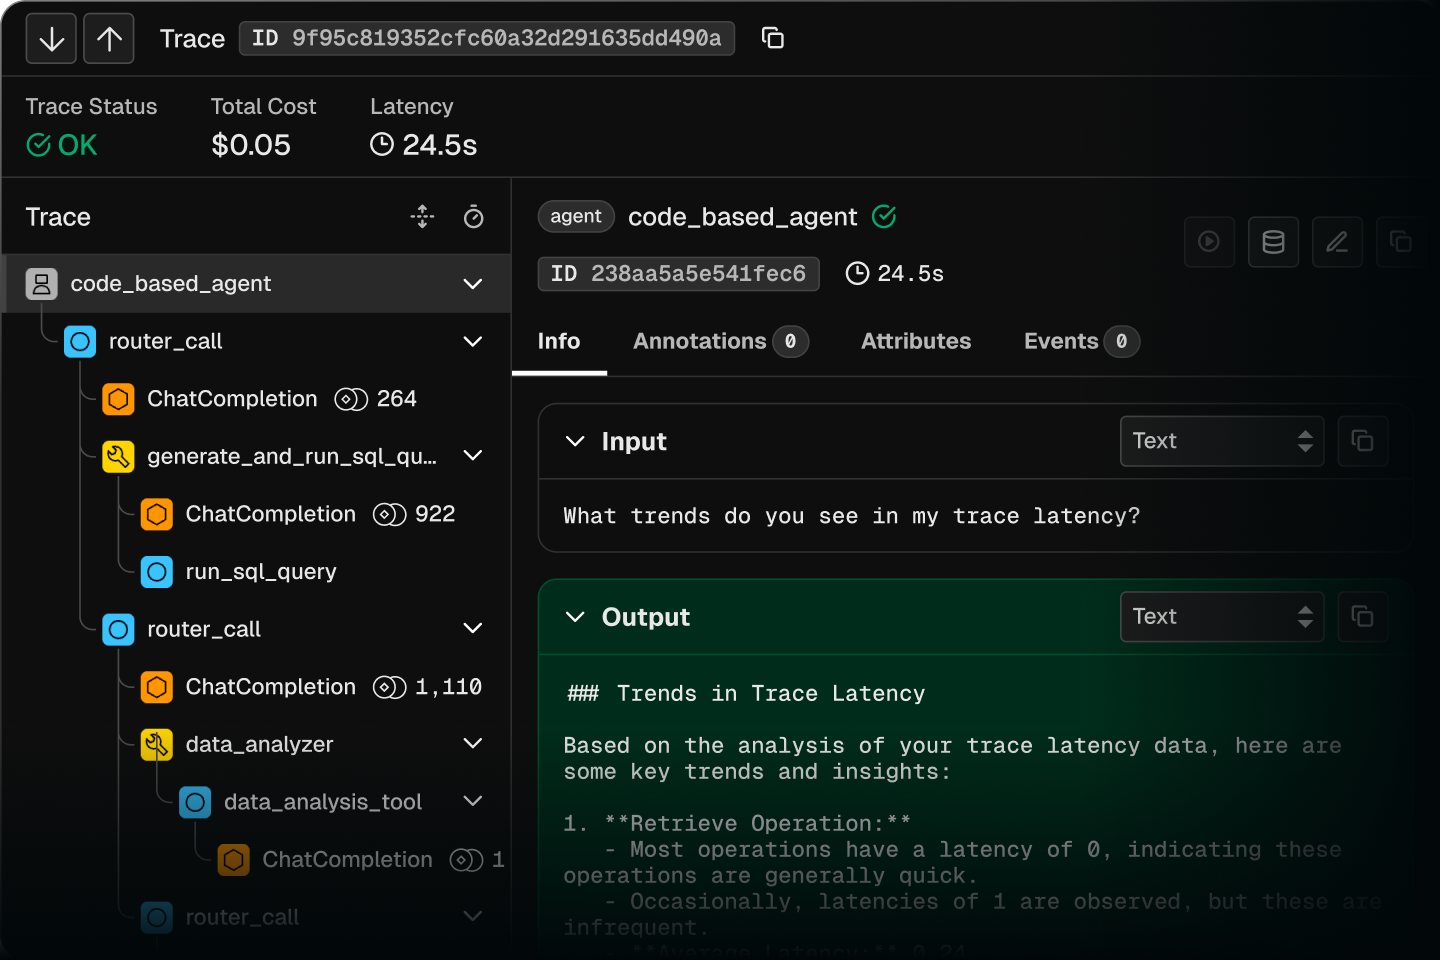
Arize Phoenix is an open-source, self-hosted platform for observing and evaluating LLM applications. Its workflow turns traces into test cases for debugging and iterative improvement, which suits teams that want control over their infrastructure. Arize AX is the managed commercial option for larger production deployments requiring automatic scaling, support and service level agreements (SLAs).
Key features
Multi-step application tracing: Captures model calls, retrieval steps, tool use and other spans, helping developers find where an agent run failed.
OpenTelemetry-based instrumentation: Uses OpenInference semantic conventions built on OpenTelemetry, so you can send standardized traces from many models and frameworks.
Flexible evaluation methods: Supports code-based checks, LLM judges and human labels for measuring response quality and identifying failures.
Dataset-driven experiments: Build datasets from application examples, test changes and compare results before releasing new prompts or models.
Prompt iteration workflow: Connects prompts with traces, evaluations and experiments, so revisions can be tested against observed application behavior.
Pricing
Arize Phoenix is a free, open-source platform for LLM tracing, evaluations, experiments and prompt iteration. You can run it locally or self-host it, which makes the software free while leaving infrastructure and any external model costs with you.
What users are saying
G2 reviewers praise Phoenix for making LLM traces easy to inspect and failures easier to diagnose, and evaluations and integrations also receive positive feedback. Some users find the initial setup difficult, especially without prior observability or machine learning operations experience. The 34 reviews provide a useful but still limited sample.
Best for
Phoenix suits developers wanting free, self-hosted LLM tracing and evaluation, with an upgrade path to managed enterprise deployment. The trade is that your team runs the infrastructure until you move to Arize AX.
6. Helicone
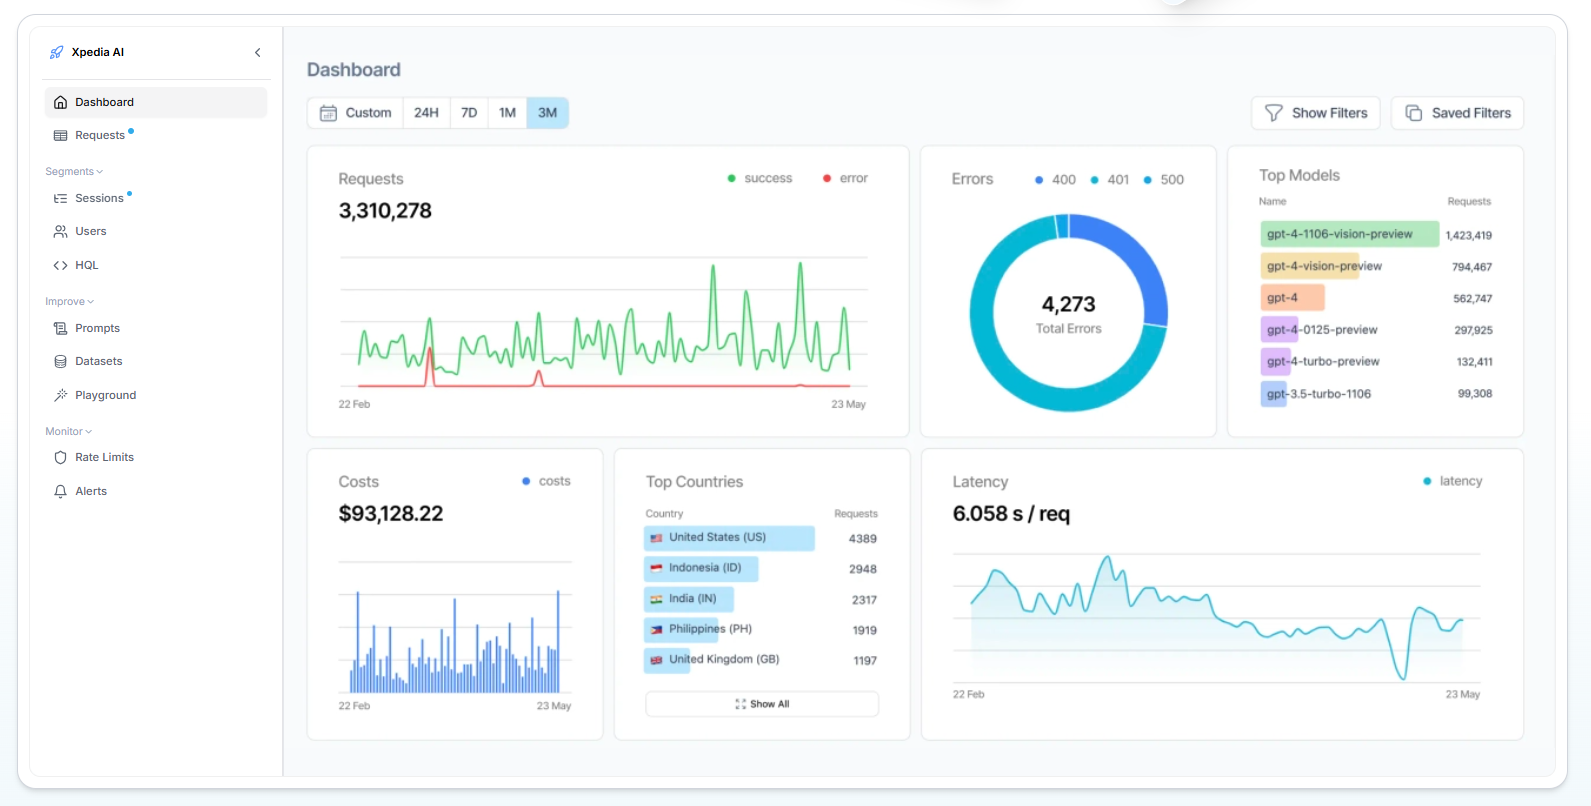
Helicone approaches LLM observability through an AI gateway placed between an application and its model providers. That position lets it capture production activity as requests pass through, giving teams operational insight without building a separate tracing pipeline. Its open-source platform suits developers who want monitoring and model routing within one workflow.
Key features
Gateway-based request logging: Automatically records prompts, responses, errors and performance data as model requests pass through Helicone.
Multi-provider routing and fallbacks: Routes requests across more than 100 models and switches providers after outages, timeouts or rate limits.
End-to-end session views: Groups LLM calls, retrievals and tool use into hierarchical sessions, so you can inspect complete agent workflows.
Granular cost tracking: Breaks down spending by model, provider, user and custom property, which makes costly usage patterns easier to find.
Custom querying and alerts: Helicone Query Language (HQL) supports detailed analysis of request data, while alerts notify teams about cost, latency and error changes.
Pricing
A free option covers a monthly request allowance with limited storage and short retention. Paid observability is a monthly subscription plus usage-based request and storage charges, and higher tiers add longer retention, compliance controls and team support.
What users are saying
Product Hunt reviewers rate Helicone 5.0 out of 5 from 13 reviews, praising quick setup, a clean interface and clear usage data, and criticism there is scarce. G2 and community feedback is more mixed, citing proxy setup complexity, awkward navigation and limited feature depth for advanced workflows.
Best for
Helicone suits teams wanting gateway-based monitoring, model routing and failover within one open-source platform. Because it sees traffic at the gateway, it tells you less about what happens inside the application around each call.
7. Weights & Biases Weave
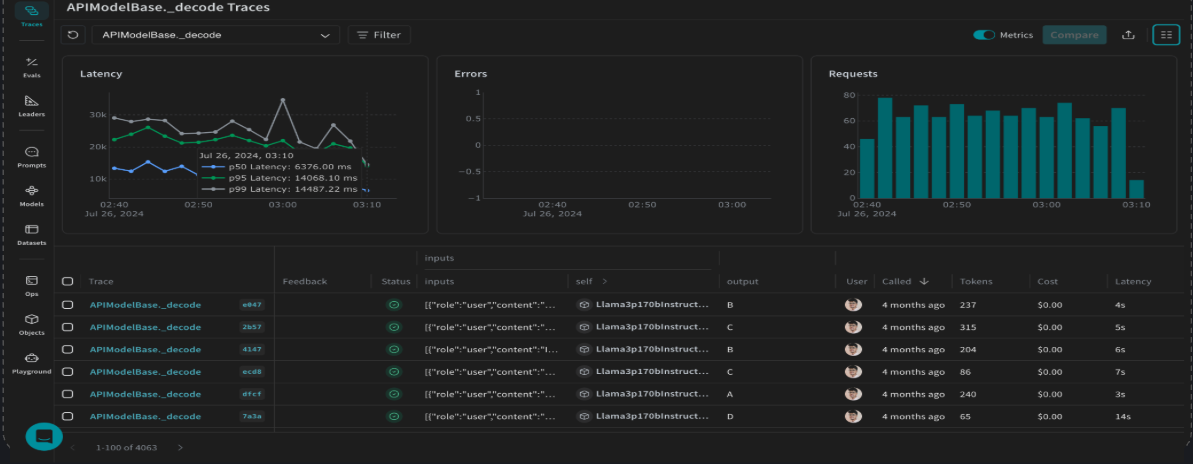
W&B Weave brings LLM observability into the wider Weights & Biases machine learning (ML) workflow. Teams can study production agent behavior while keeping findings close to their existing models, datasets and experiments, which makes Weave a natural extension for ML teams moving from model development into production LLM and agent monitoring.
Key features
Agent-native tracing: Organizes sessions into turns, steps, tool calls and sub-agents, helping you follow how complex agents reached an outcome.
Production behavior signals: Built-in and custom signals classify agent interactions, and alerts and webhooks help teams act on emerging failure patterns.
Flexible evaluation framework: Supports LLM judges and custom scorers, with comparison views that expose quality changes before release.
Production-linked playground: Lets you test prompts and models against real traces, connecting observed failures with focused experiments.
OpenTelemetry-compatible collection: Accepts OpenTelemetry spans and offers Python and TypeScript libraries for instrumenting varied application stacks.
Pricing
Free cloud-hosted LLM tracing, evaluations and scorers come with a monthly ingestion allowance. Paid cloud access is a monthly subscription that then adds ingestion charges, while privately hosted corporate deployments use custom pricing and free local hosting is limited to personal use.
What users are saying
Dedicated Weave reviews on G2 remain scarce. Broader W&B reviewers praise experiment tracking, visualization and collaboration, while citing high per-user pricing, interface complexity and a steep learning curve. On Reddit, Weave users value simple tracing, evaluations and dataset management, though some report library and integration issues.
Best for
Weave suits ML teams connecting production agent traces and evaluations with existing W&B model experiments. Teams without W&B already in place get less from that connection.
8. Braintrust
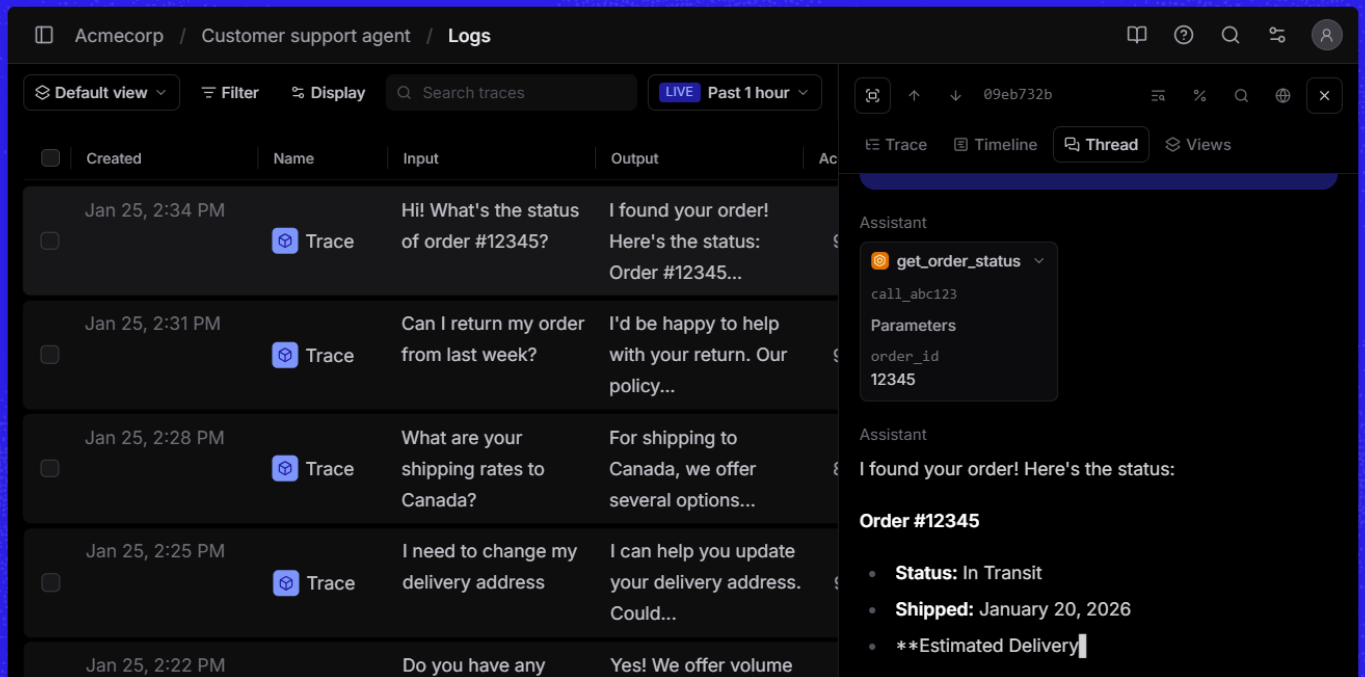
Braintrust takes an evaluation-led approach to LLM observability. Its workflow moves production evidence into repeatable tests before teams release prompt, model or agent changes, which helps developers measure whether a proposed fix improves quality across known failures and edge cases. The platform also supports collaboration between engineering, product and subject matter reviewers.
Key features
Nested production tracing: Captures prompts, responses, tool calls and agent steps, with search and filtering for investigating individual failures.
Trace-to-dataset conversion: Turns selected production traces into evaluation cases, so real failures become regression tests.
Flexible output scoring: Measures responses with LLM judges, code-based checks or human review, covering subjective and deterministic quality criteria.
Comparative experiments: Tests prompts, models and agent versions against shared datasets, then presents results side by side for release decisions.
Quality and cost dashboards: Tracks scores, request volumes, latency, token use and costs across production logs and evaluation experiments.
Pricing
Free LLM tracing and evaluation come with allowances for processed data, automated scores and model usage. Paid access is a monthly subscription that then scales with data, scoring and retention, and high-volume or privacy-sensitive deployments use custom pricing.
What users are saying
G2 feedback is split across Braintrust's AI observability platform and a separate talent marketplace, which makes its overall rating unreliable here, and dedicated observability reviews remain limited. Relevant reviewers praise prompt and model comparisons, tracing and structured test histories, while some describe a steep learning curve for advanced evaluation workflows.
Best for
Braintrust suits evaluation-led teams turning production failures into repeatable tests before changing prompts, models or agents. Its focus is release quality, so teams after infrastructure correlation may want to pair it with something broader.
9. Dynatrace
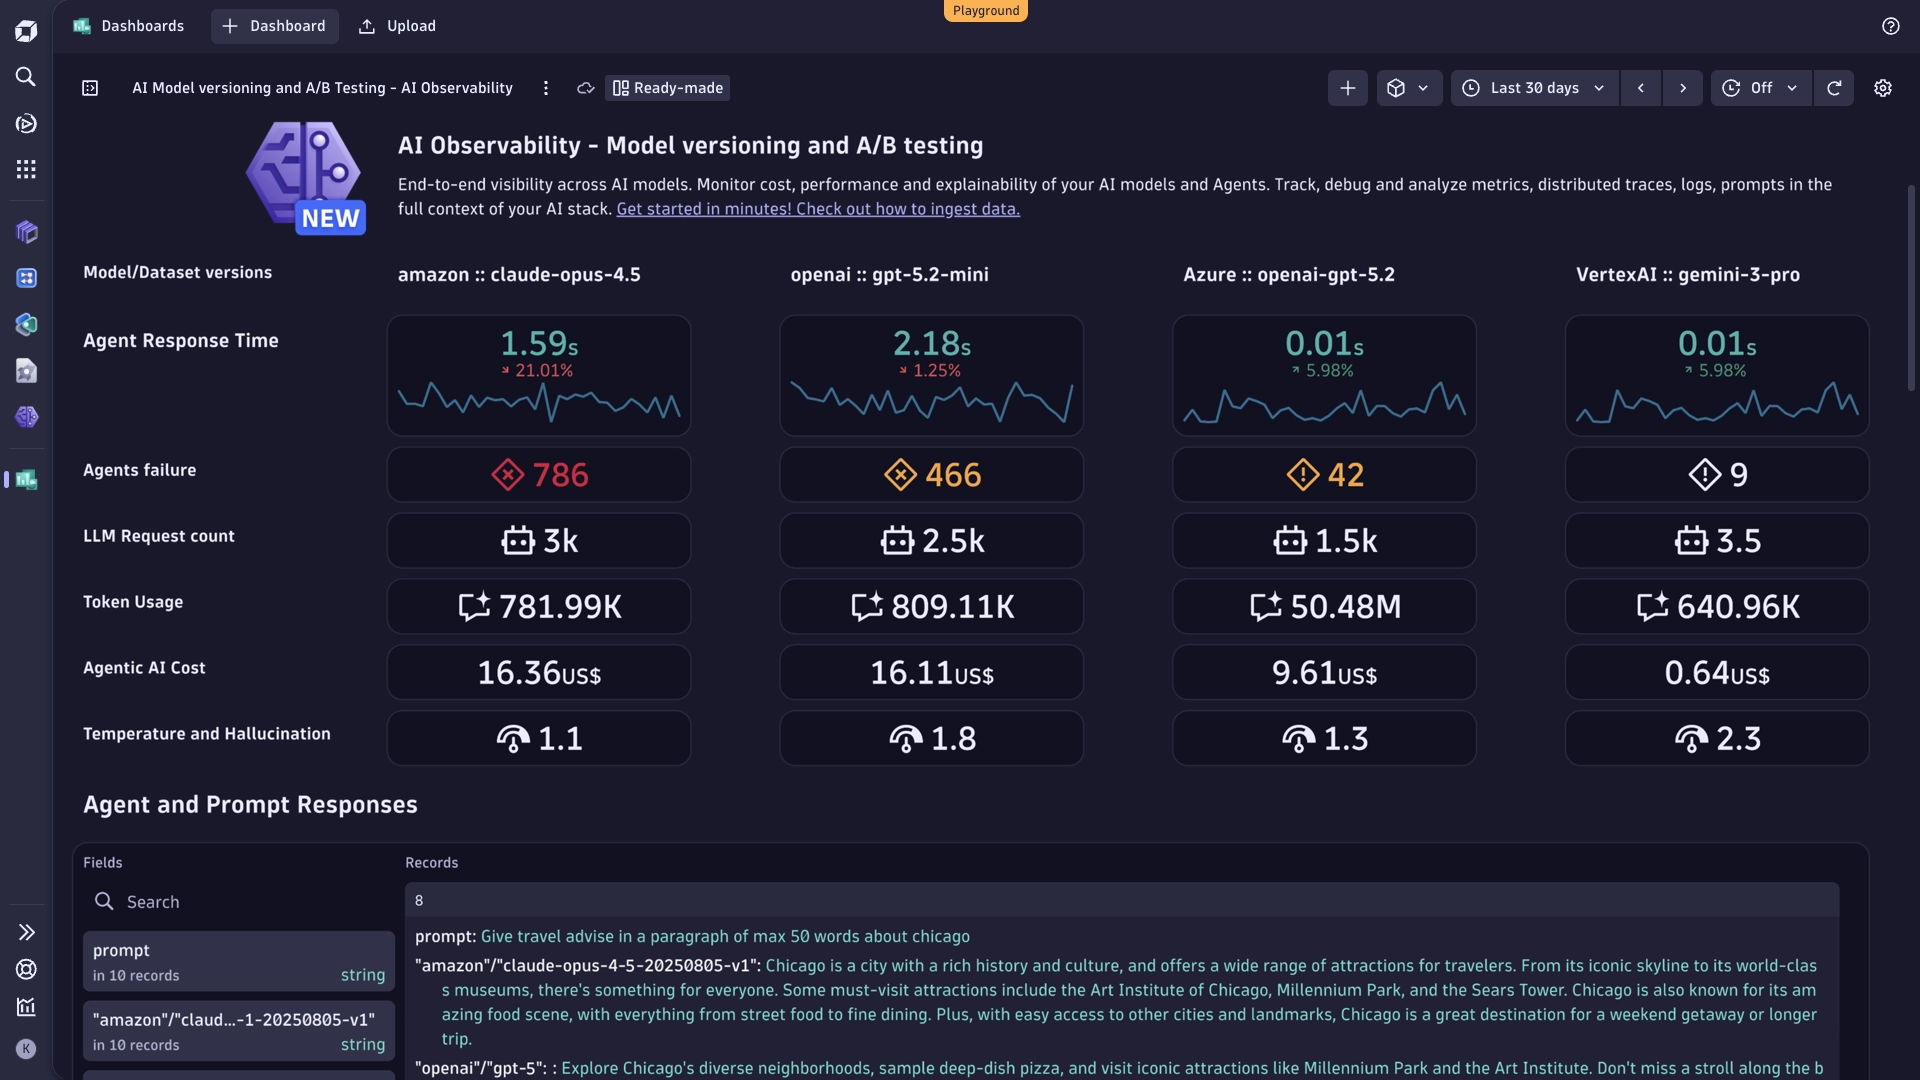
Dynatrace extends enterprise observability into LLM applications and agents. It places AI behavior within the wider context of applications, services, infrastructure and user journeys, which helps operations teams investigate whether an AI failure began in a model, an orchestration framework, a retrieval layer or a supporting system.
Key features
Full-stack AI request tracing: Follows requests across frontends, backends, orchestration frameworks, retrieval-augmented generation (RAG) pipelines and LLMs to locate failure points.
Production response evaluation: Uses LLM judges to score relevance, safety and quality, then links each result to its original trace.
Multi-agent workflow visibility: Tracks execution paths, tool calls, function calls and agent-to-agent communication across complex workflows.
Model performance and cost monitoring: Measures tokens, latency, availability, errors and model costs, so you can detect degradation and spending changes.
Infrastructure-level correlation: Connects AI behavior with vector databases, GPUs, TPUs and cloud services for wider root cause analysis.
Pricing
Dynatrace prices LLM observability through an annual platform commitment rather than a separate AI package. Usage draws from its rate card, which meters trace ingestion, retention and queries by volume, or charges full-stack monitoring per host by memory size.
What users are saying
G2 rates Dynatrace 4.5 out of 5 from more than 1,300 reviews, while Gartner reports 4.6 out of 5. Reviewers value full-stack visibility, automated discovery and faster root cause analysis, while pricing complexity, a steep learning curve and a crowded interface recur across G2, Gartner and Capterra. Most of this feedback covers Dynatrace overall, and feedback on its AI observability specifically remains limited.
Best for
Dynatrace suits large enterprises correlating agent failures with application dependencies, cloud infrastructure and user impact across complex estates. Smaller teams with simpler estates may find they are paying for depth they do not yet use.
10. HoneyHive
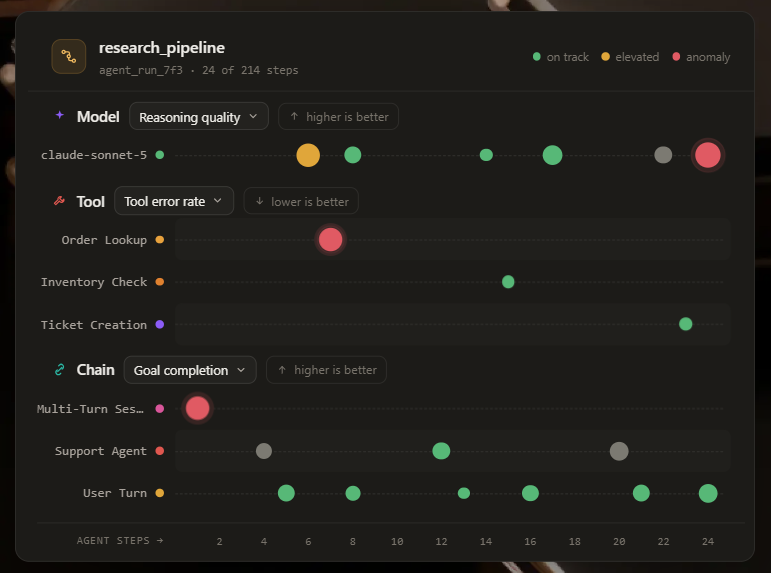
HoneyHive is an evaluation-led observability platform for production AI agents that connects production monitoring with release testing. Teams can investigate traces, convert real failures into test datasets, compare agent versions and gate releases using evaluation results, which helps them manage behavioral changes across prompts, models, tools and multi-agent systems.
Key features
Agent trajectory tracing: Captures prompts, tool calls, retries, loops and sub-agent handoffs across long-running sessions.
Production quality monitoring: Applies online evaluations to live traffic and alerts teams when quality scores drift or cross defined thresholds.
Failure-driven datasets: Converts problematic production traces and edge cases into reusable datasets for regression testing.
Cross-release experiments: Compares prompts, models and configurations against the same dataset, highlighting improvements and regressions before deployment.
Evaluation gates: Combines LLM judges, code-based checks and human reviews with CI workflows that can block underperforming releases.
Pricing
HoneyHive offers free LLM observability with a monthly event allowance, a small number of users and limited retention, including tracing and evaluations. Larger teams receive custom pricing for higher limits, advanced security, dedicated support, and SaaS, hybrid or self-hosted deployment.
What users are saying
Gartner gives HoneyHive 4.3 out of 5 from three ratings. Its visible review values automated evaluations and side-by-side experiments, but flags time-consuming onboarding and unclear setup documentation. FeaturedCustomers offers three positive customer stories, though these are curated, and with little independent feedback the wider user experience remains hard to judge.
Best for
HoneyHive suits product and engineering teams turning production agent failures into regression tests and release gates. With so little independent feedback, it is worth a longer trial than the others before you commit.
Related terms
- AI observability in your own cloudAI observability helps your team understand how models, agents, applications and infrastructure behave in production.
- BYOCBYOC, Bring Your Own Cloud, is a deployment model where a vendor's software runs inside the customer's own cloud account, operated by the vendor but living on infrastructure the customer owns.
- DatadogDatadog is the largest SaaS observability platform, spanning infrastructure monitoring, APM, logs, RUM, security, and dozens of adjacent products, collected largely through its proprietary agent and priced per product.
- DynatraceDynatrace is an enterprise observability platform known for its OneAgent automatic instrumentation, the Davis AI engine for root cause analysis, and the Grail data lakehouse, sold on a consumption based pricing model.
- LLM observability explained: how to monitor performance, quality and costLLM observability tells you whether your AI application is fast, reliable, useful and affordable in production, which uptime and error rates alone cannot.
- OpenTelemetryOpenTelemetry is an open source framework for generating, collecting, and exporting telemetry: the logs, metrics, and traces that describe how software behaves in production.
- TraceA trace is the end to end record of one request or workflow as it moves through a system, composed of all the spans that share a single trace ID.