Lexicon · Guide
Agent observability: tracing AI decisions, tools, cost and performance
Agent observability traces every decision, tool call and dollar across a multi-step AI run. What to capture, which signals matter, and how to instrument it.
Quick summary
Agent observability tracks the full path from a user's request to the final outcome, covering decisions, model calls, tools, Model Context Protocol (MCP) interactions, memory, cost and quality. Effective monitoring combines run-level traces, agent-specific golden signals and OpenTelemetry context. Tsuga supports this at scale by keeping sensitive telemetry inside your own cloud, with governed access.
In an agent trace, the root represents the task. Child spans represent model calls, decisions, tools, memory operations and agent handoffs, and their relationships often reveal more than any individual output.
Consider an onboarding agent that gathers customer data, checks sanctions lists and creates a compliance summary. Its screening tool could return HTTP 200 with an empty result, and the agent may interpret the empty response as clearance and continue.
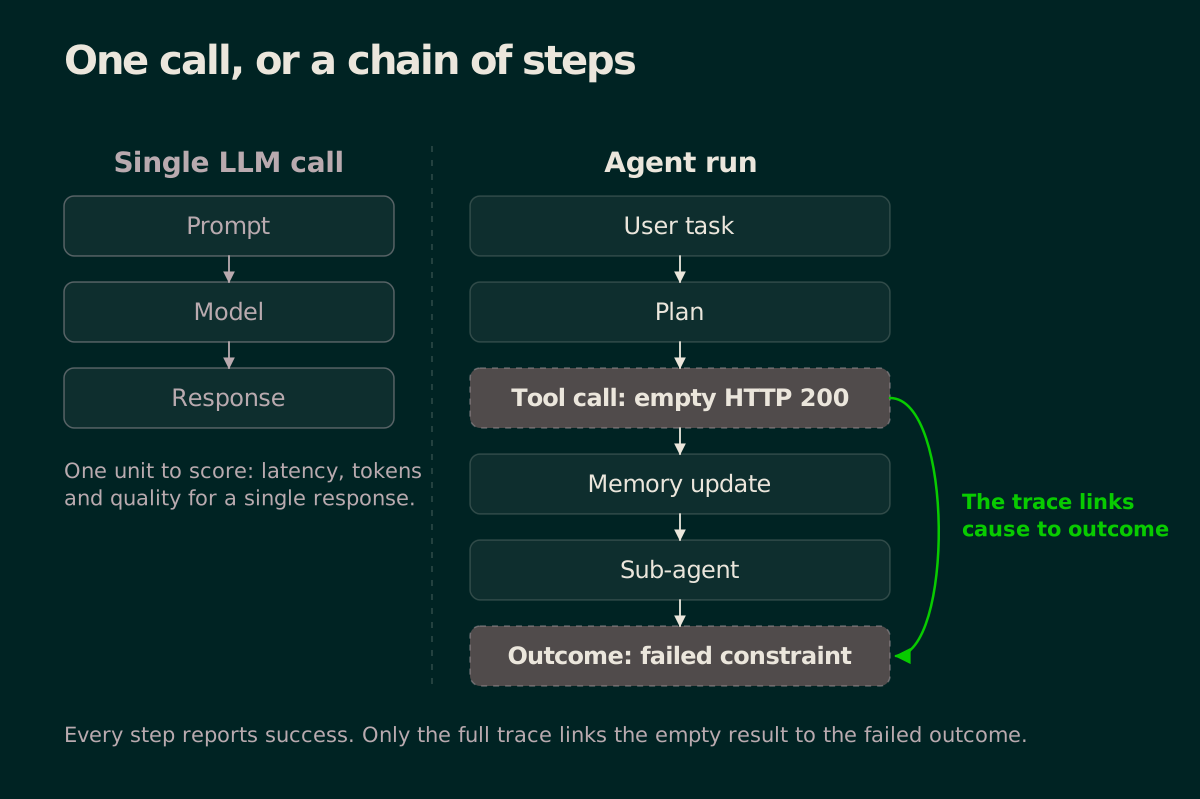
Latency, uptime and error dashboards would still look healthy. The full trace would reveal the empty payload and the decision based on it.
Agents also introduce failure modes that single-call monitoring may miss. They can select the wrong tool, repeat steps, lose context during handoffs or stop too early, so a run may appear successful to the system while failing the user's task. The MAST study identified 14 failure modes across multi-agent systems, grouped into three categories: system design, inter-agent misalignment and task verification. Many appeared across sequences of actions rather than within one model call.
Cost also needs to be measured across the complete run. One task may include several model calls, retrieval queries, paid APIs, retries and human review. A cheap model can still create an expensive workflow if weak decisions cause repeated attempts, which is why cost per successful task is a clearer measure than cost per call.
What should you capture across multi-step agent runs?
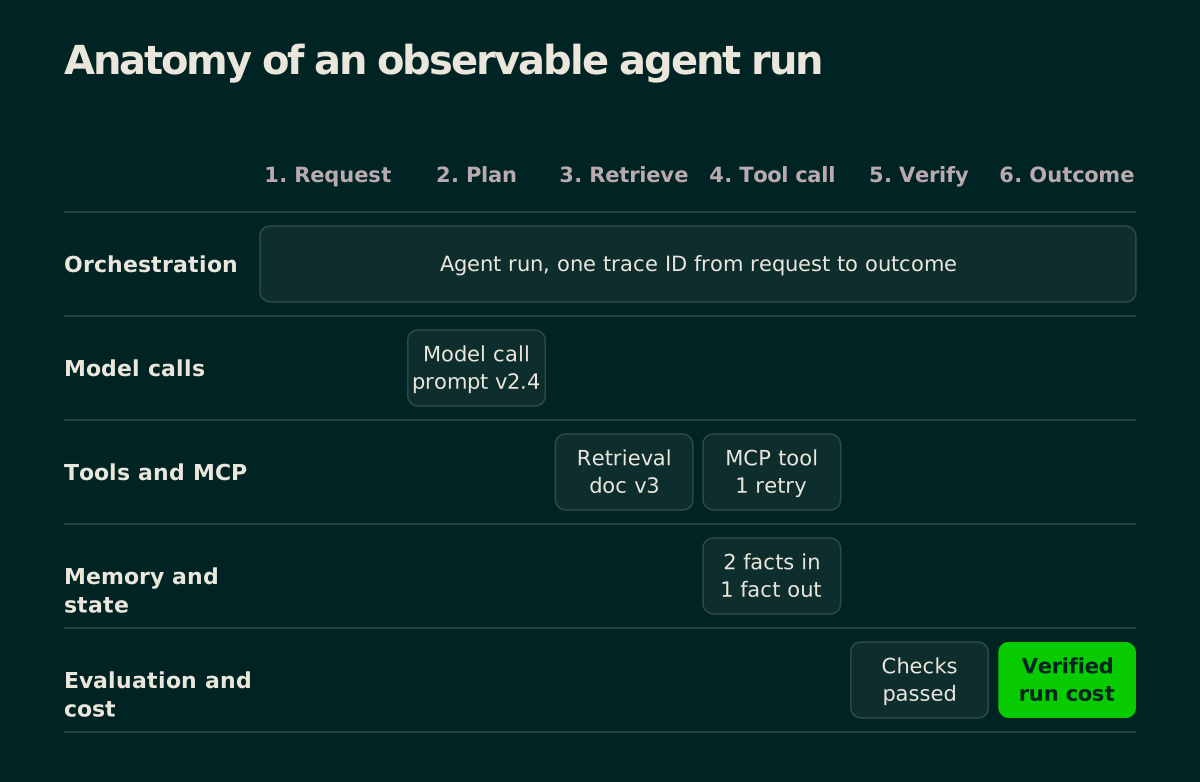
A useful trace must connect the agent's individual actions to the final outcome. These are the main elements to capture across each run.
1. The complete run and each step
One core AI agent observability best practice is to create a parent span for the full run. Add child spans for planning, model calls, retrieval, memory operations, tool use and agent handoffs, and give each span a step number, start and end time, status and parent span ID.
The step number turns separate events into an ordered trajectory. It lets you calculate steps per task and locate repeated actions, while parent-child links show which decision caused a tool call or sub-agent request.
Include the agent name and version on the run. Version data is vital when a prompt, model or workflow change raises cost or lowers completion rates. Also record the task type and final outcome. Avoid placing customer or session identifiers in metric labels, where high cardinality can overwhelm the time-series database.
2. Decision paths and state changes
Record the action the agent selected, the available tools and the model's finish reason. A finish reason such as tool_calls marks a decision to act, and a series of 15 such results can expose a loop even when each call succeeds.
Store the arguments passed to the chosen tool after applying redaction rules. Most model APIs do not reveal every option considered, but you can still preserve the system instructions, tool definitions and context used at the decision point. These records support later reviews of why a choice was reasonable or unsafe.
State changes deserve their own events or spans. Capture which memories were read, what new facts entered working context and which items were removed, and store retrieved document IDs and versions. If false information spreads through shared memory, the state history can reveal where it first appeared.
3. Tool calls and MCP interactions
Tool spans need more than a name and duration. Capture the server, tool name, transport, request size, response size, status, retry count and timeout. For MCP calls, correlate the agent-side request with the MCP server's execution span, otherwise the trace shows what the agent attempted without proving what the server ran.
Classify failures with more detail than success or error. Useful classes include timeout, transport error, malformed response, empty response, partial response, policy denial and invalid content. A 200 response with an empty result can be more dangerous than an explicit 500, because the agent may continue with false confidence.
Large tool responses should not sit inside span attributes. Store the content in approved object storage and attach a reference, size and hash, which keeps traces usable while preserving evidence for deeper investigations.
4. Cost and quality for the whole run
Record input, output and cached tokens for each model call. Add retrieval charges, third-party API fees, tool compute, retries, fallbacks and human escalation. Keep usage units separate from calculated currency values, so historical costs can be recalculated after a provider changes its pricing.
Roll these values up to total cost per run and cost per successful task. Segment the totals by agent version, workflow, feature and tenant where policy allows.
Quality evidence should also follow the trajectory. Save cited document IDs, grounding checks, policy results and evaluator scores beside the step they assess. For numeric tasks, compare asserted values with the tool results available at the time, which can catch a figure that appeared without a supporting source.
How to instrument AI agents with OpenTelemetry
OpenTelemetry offers a vendor-neutral way to connect agent activity with application and infrastructure telemetry. Its GenAI semantic conventions define shared names for model operations, agent runs, tool calls, token use and conversations. The conventions now live in a dedicated GenAI repository and remain under active development, so pin the version you implement and review changes before upgrading.
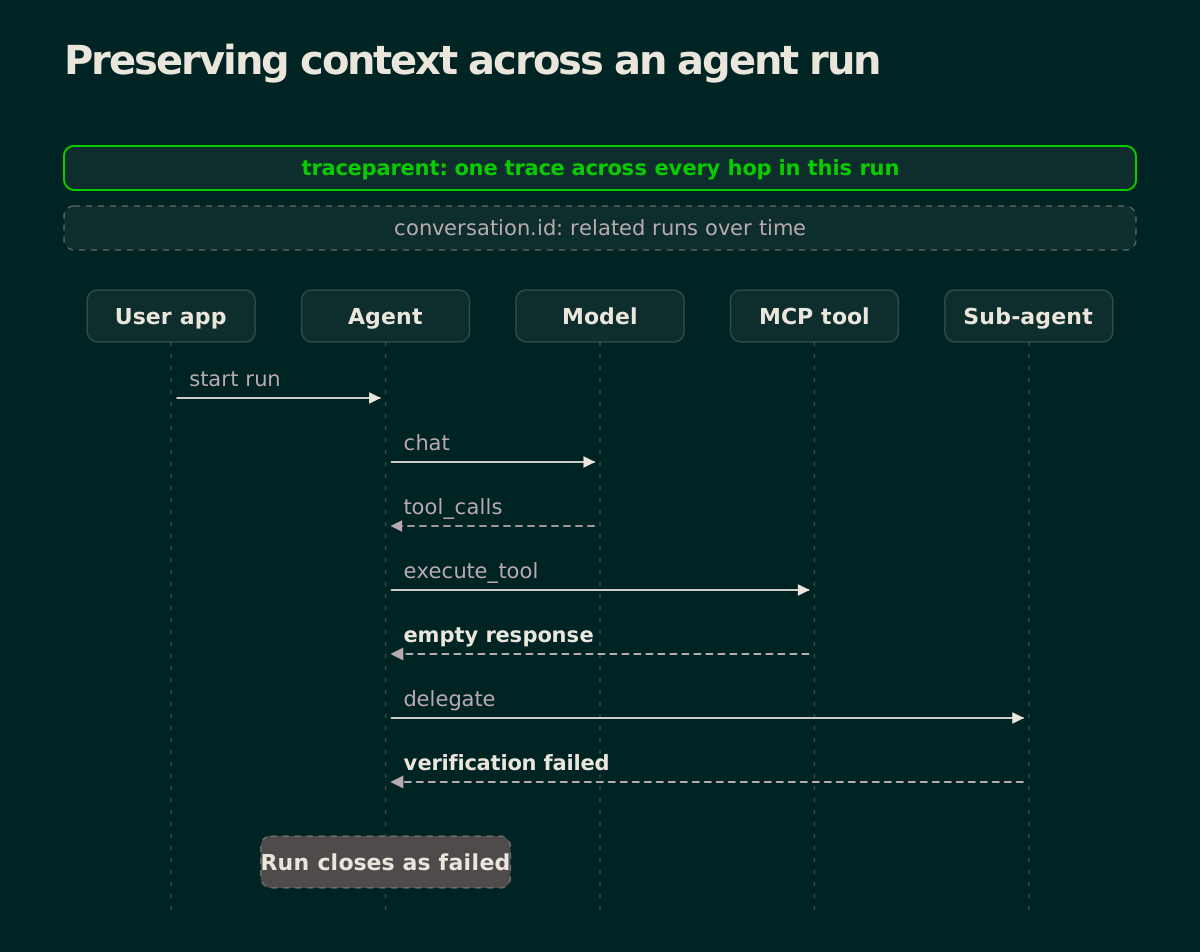
Start with three levels of spans, nested inside one another. Each level answers a different question about the run, from what the agent set out to do down to which tool it called.
Agent span: Wrap the full run in an invoke_agent span. Add gen_ai.agent.name, gen_ai.agent.version and gen_ai.operation.name.
Model spans: Create a child span for each model request. Record the requested and returned models, token usage, latency and finish reasons.
Tool spans: Create an execute_tool span for each tool call. Record the tool name, call ID, transport, status and retry data.
Use standard attributes wherever the conventions define them. Common fields include gen_ai.request.model, gen_ai.response.model, gen_ai.usage.input_tokens, gen_ai.usage.output_tokens and gen_ai.response.finish_reasons. Add error.type when an operation fails, and keep custom planning, safety, memory and MCP governance fields inside a small, documented namespace. This makes later migration easier as the standard matures.
Automatic software development kit (SDK) instrumentation can capture many model calls. Manual spans are usually needed for planning, memory access, policy checks, delegation and the parent agent loop. Without those spans, a trace can show model and tool activity while hiding the orchestration that joined them.
Keep trace and session context separate
A trace ID links spans within one distributed execution. Propagate it across HTTP and agent boundaries using the W3C traceparent header, and have the receiving service create a child span under the existing context. Starting a new trace at each handoff breaks the causal path.
gen_ai.conversation.id groups related messages within a conversation, and it can span several traces and agent runs. The OpenTelemetry guidance says not to invent a random conversation ID when none exists, so use the real identifier maintained by the application. Keep a separate session identifier if your product groups several conversations into one user session.
Control content capture
Prompts, outputs, tool arguments and retrieved records can contain personal data or source code. Capture them only through an explicit policy, apply redaction before export, and restrict access separately from ordinary metrics.
For large or sensitive content, place the payload in storage you control and add a reference and content hash to the span. The trace retains its evidence without copying the full payload into each backend.
Test context propagation before production rollout. Send one request through a model, a tool and a sub-agent, and confirm that each span shares the expected trace ID and has the correct parent. Then force a timeout and an empty tool response. Both cases should appear under the same run with distinct failure classes.
Finish with two checks. Propagate child failures to the parent run, so a failed sub-agent does not leave a green root span, and emit aggregate histograms for token usage, duration and steps. Keep high-cardinality values in traces rather than metric labels.
What makes AI agent observability challenging?
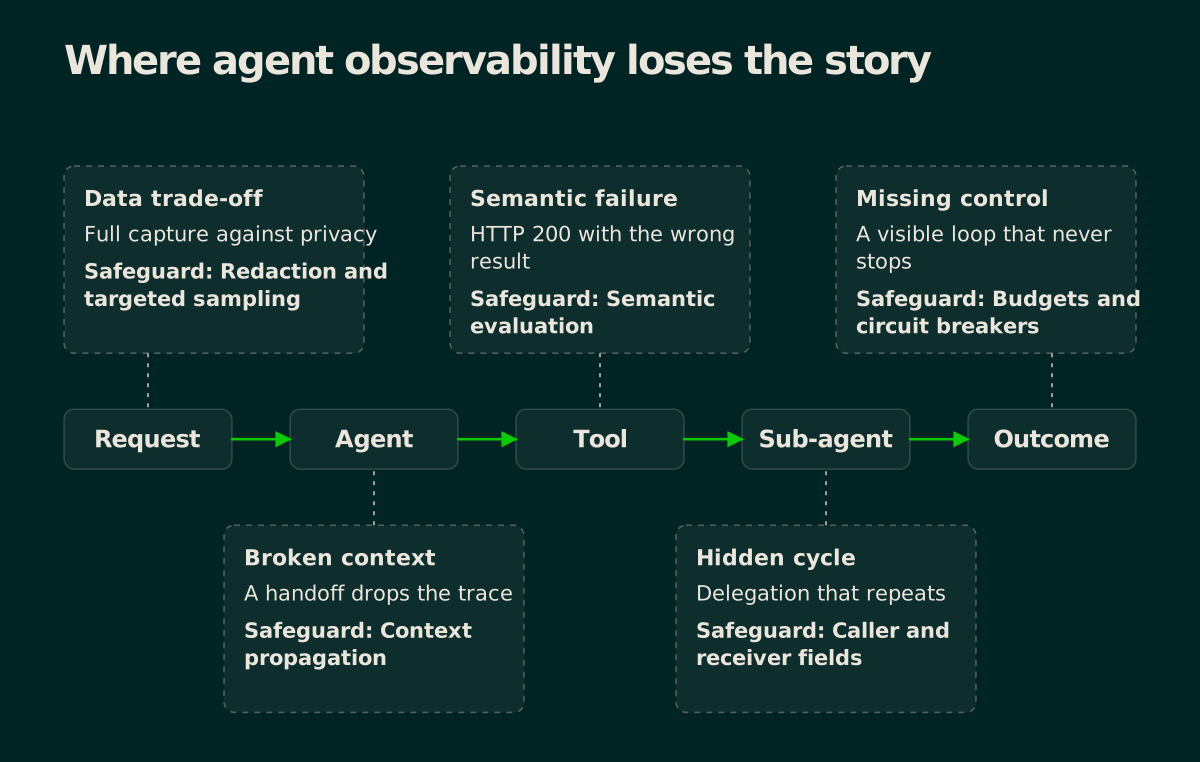
Several factors make AI agent activity harder to observe than standard application requests. These are the main challenges to account for.
Failures do not always look like failures
A tool may return HTTP 200 with incomplete data, and a sub-agent may produce valid JSON with the wrong conclusion. Both operations appear healthy at the system level. Detecting the problem requires semantic checks that assess the response against the task, the available evidence and the user's constraints.
Success can also be difficult to define. A completed payment has a clear outcome, while a research summary may need human review or a groundedness evaluator.
Non-determinism makes normal behavior harder to define
The same request can follow several valid paths. One run may use three tools while another uses five and still reach the same result, so fixed thresholds can create noisy alerts or flag healthy variation as failure.
You need baselines based on task type, agent version and outcome. Evolving GenAI conventions add another layer of uncertainty, so schema versions and custom fields must be documented and tested as frameworks and backends change.
Agent traces can break or hide important relationships
A run may cross model providers, MCP servers, queues, background jobs and other agents. Each system must accept and forward trace context, and one missing handoff can divide a single run into unrelated fragments.
Trace trees also struggle to show cycles clearly. If Agent A calls B, B calls C, and C returns work to A, the loop may resemble one long branch. Caller, receiver, delegation direction and step attributes help reconstruct the interaction graph.
Telemetry volume creates cost and privacy trade-offs
One task may produce dozens of spans alongside prompts, tool payloads, memory events and evaluations. Capturing full content increases storage costs and may expose credentials, personal data, source code or internal records.
Aggressive sampling can remove the step needed to explain a failure. You need content references, redaction, access controls, tiered retention and sampling rules that preserve failed or unusual runs.
Visibility does not provide enforcement
Observability can reveal a runaway loop, policy breach or rising cost after it begins, but it cannot stop the next model or tool call by itself. Production agents also need step budgets, timeouts, spend limits, approval gates and circuit breakers, and trace data helps these controls decide when to warn, block or end a run.
How Tsuga supports AI agent observability at scale
Agent runs produce sensitive telemetry across models, tools, memory and applications. We help you manage that data through three parts of our architecture.
Keep agent telemetry within your cloud
Tsuga uses a bring your own cloud (BYOC) model. We deploy the Tsuga Engine inside your AWS, Google Cloud or Microsoft Azure environment, and telemetry stays in your storage, encrypted with your own key management service (KMS) keys.
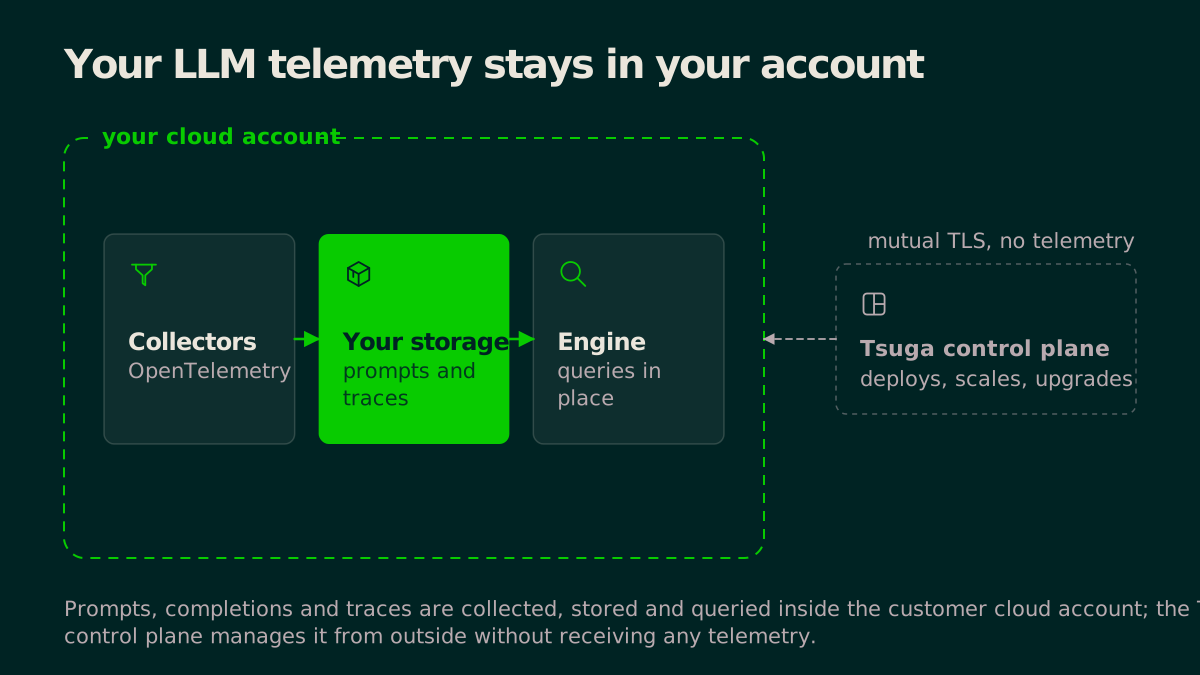
This design keeps prompts, source code, customer records and internal business logic within your existing security perimeter. You keep control over access and retention, while we manage deployment, upgrades, scaling and recovery through our control plane.
Connect agent traces with the wider stack
Tsuga is built on open foundations, including OpenTelemetry, Prometheus and Fluent Bit. Agent traces exported through OpenTelemetry sit beside application, infrastructure and log data.
Your engineers can follow an agent decision into the API, database, queue or service it affected. We extend this context to AI assistants through our agent-native observability architecture, which provides structured access across logs, metrics and traces, and our MCP server lets approved AI assistants query telemetry from your existing workflows. You can also bring your own AI agent, use an approved model, and keep investigation loops within your cloud environment.
Control telemetry volume without losing context
Tsuga includes observability pipelines with field-level transformation and routing rules. You can redact sensitive fields, route different telemetry classes and reduce low-value data before storage.
We work closely with your team to tune pipelines, retention and access while reducing unnecessary data volume. Because telemetry stays in your cloud, storage and transfer show up on your own cloud bill, and open formats keep the underlying buckets and indexes under your control.
Tsuga provides a controlled data layer for agent observability. Single sign-on (SSO), role-based access, audit logs, retention policies and team boundaries support governance while your teams keep control of their telemetry. To see how this would work with your telemetry, security and scale requirements, talk to an architect.
Related terms
- AI observability in your own cloudAI observability helps your team understand how models, agents, applications and infrastructure behave in production.
- CardinalityCardinality is the number of distinct values, or distinct value combinations, that an attribute or set of attributes can take.
- LLM observability explained: how to monitor performance, quality and costLLM observability tells you whether your AI application is fast, reliable, useful and affordable in production, which uptime and error rates alone cannot.
- Semantic conventionsSemantic conventions are OpenTelemetry's standard vocabulary: the agreed names, types, and values for the attributes that describe telemetry.
- TraceA trace is the end to end record of one request or workflow as it moves through a system, composed of all the spans that share a single trace ID.
- We reviewed 10 reliable LLM observability tools for production teams in 2026The top LLM observability tools are Tsuga, Langfuse, LangSmith, Datadog, Arize Phoenix, Helicone, W&B Weave, Braintrust, Dynatrace and HoneyHive.